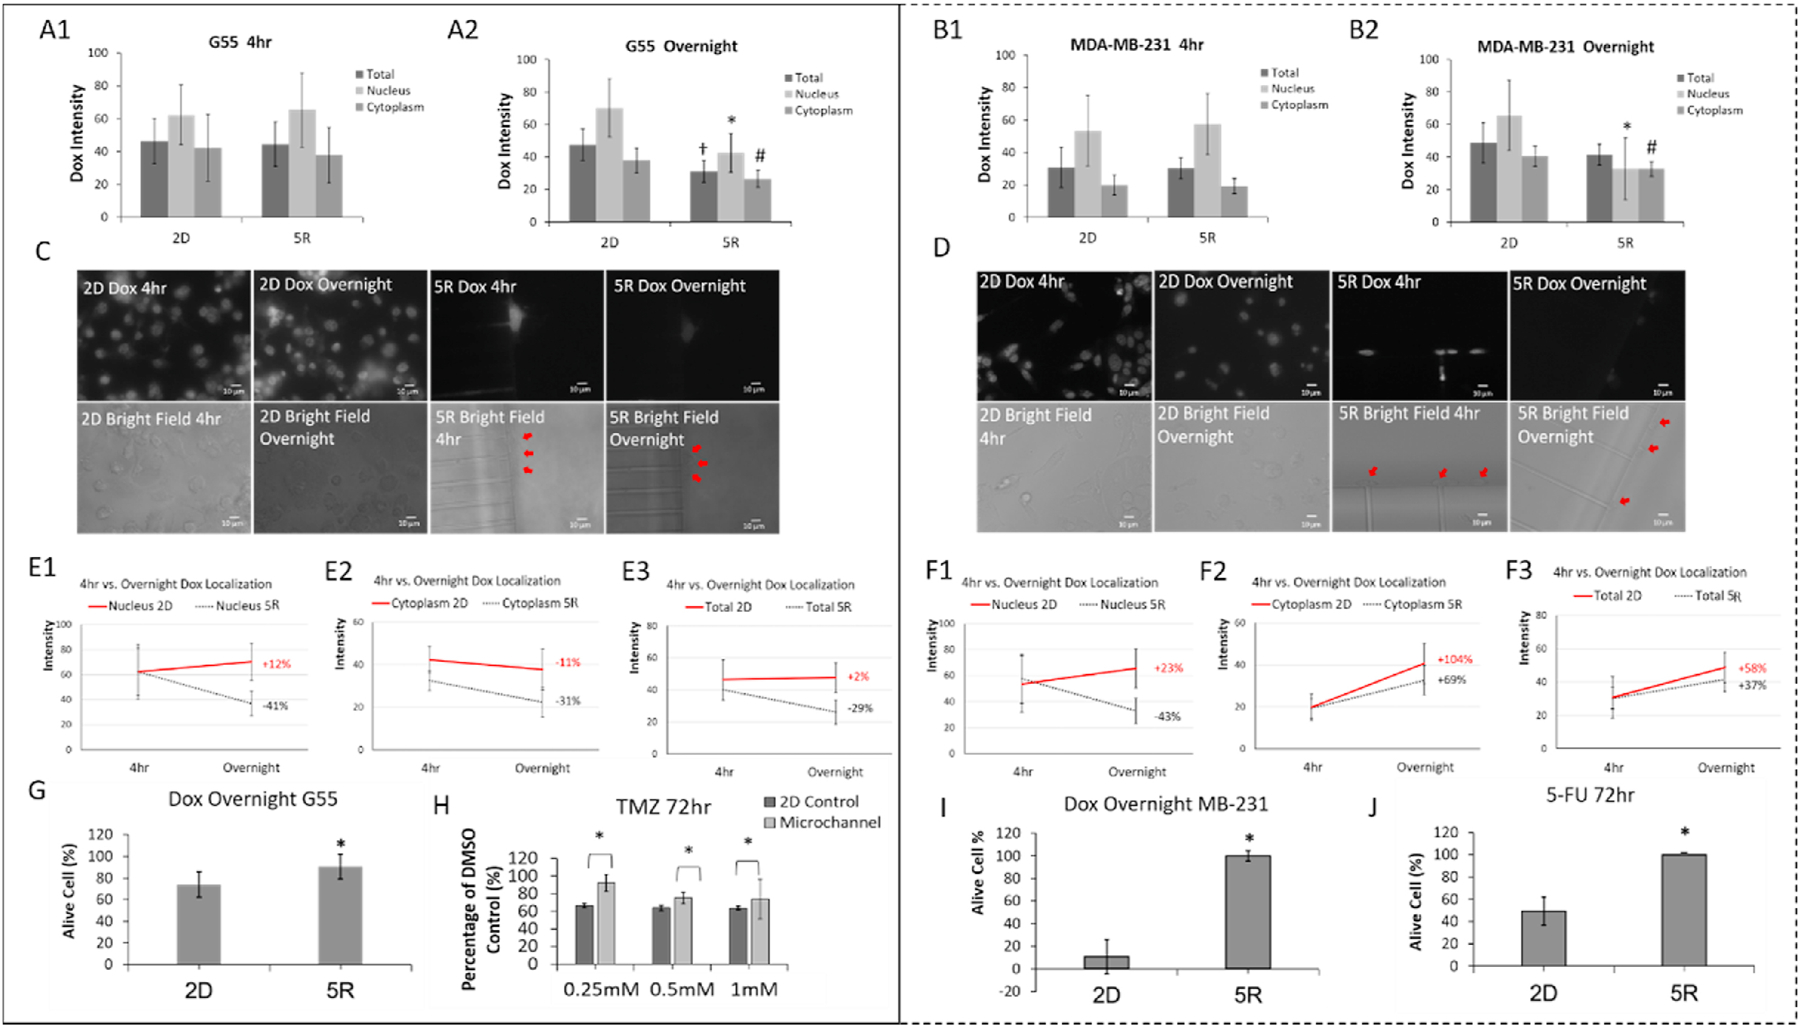
Fig. 1. Confined-migrating cancer cells develop chemotherapeutic resistance by increasing drug efflux.

(left panel are G55 results and right panel are MDA-MB-231 results). A-B. Quantitative comparison of Dox intracellular accumulation between 2D culture (2D) and cancer cells that migrated through 5 × 5 μm microchannels (5R). Dox (17μM) was introduced to all cancer cells then removed after 4 hours and replaced with the Dox free medium. After overnight incubation with Dox free medium, Dox intensities were quantified in the nucleus, cytoplasm and whole cell (total). N>20 per group. All experiments were triplicated. †p<0.05 between 2D total and others; *p<0.05 between 2D nucleus and others; #p<0.05 between 2D cytoplasm and others. C-D. Representative images of Dox accumulation in 2D culture and cells which have migrated through 5 × 5 μm microchannels (red arrows). E-F. Changes of Dox intensity over time under different degrees of confinement. Percentage shows intensity changes between 4 hr and overnight. N>20 per group. G and I. Viability after Dox (17 μM) 4 hr treatment plus overnight Dox free incubation. N>20 per group. *p<0.05 between 2D and others. H. G55 cell viability after Temozolomide treatment (0.25 mM, 0.5 mM or 1 mM) for 72 hours. *p<0.05. J. MDA-MB-231 cell viability after 5-Fu (5 μM) treatment for 72 hours. *p<0.05. Experiments were replicated.
