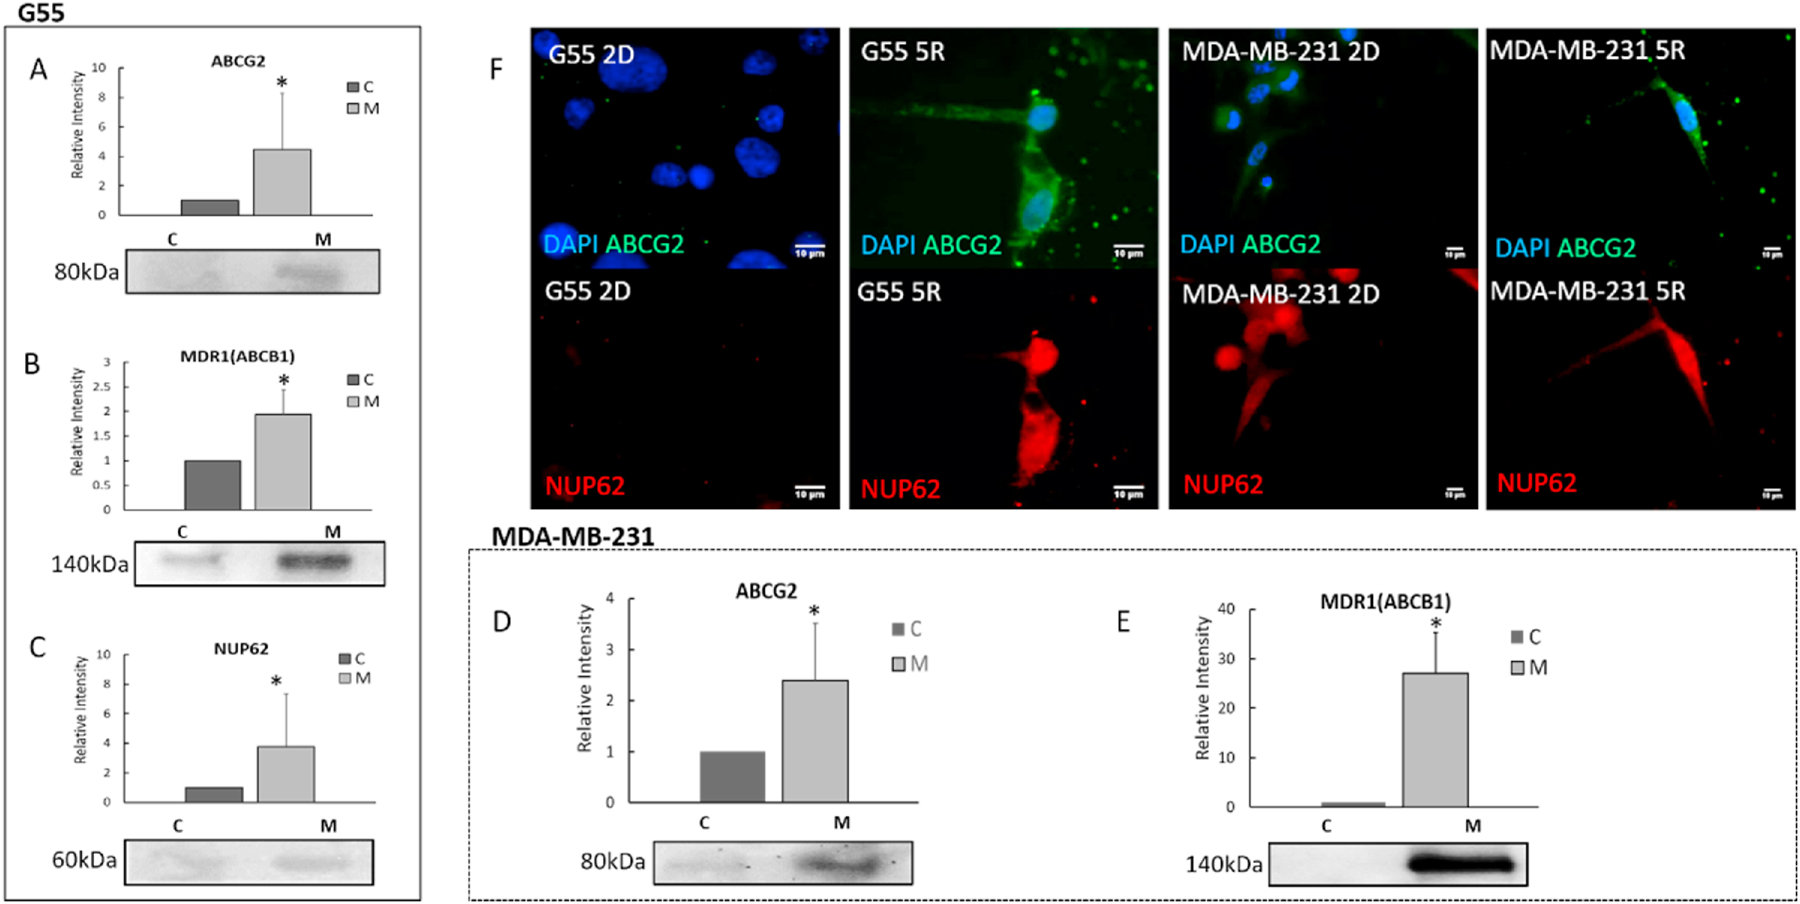
Fig. 3. Confined-migrating cells express significant increased drug efflux proteins.

A-C. Quantitative comparison of drug efflux proteins (ABCG2, MDR1 and NUP62) between G55 confined-migrating cells (indicated by M) and 2D cells (indicated by C). D-E. Quantitative comparison of drug efflux proteins (ABCG2 and MDR-1) in MDA-MB-231 confined-migrating cells (indicated by M) and 2D cells (indicated by C). All Western blot results were normalized by the total protein concentration. (Average + Std). All experiments were reproduced. *p<0.05. F. Representative immunostaining images of NUP62 and ABCG2 for G55 (left) and MDA-MB-231 cells in 2D culturing and after migrating through 5 × 5 μm microchannels (5R, right). Blue: DAPI; Red: NUP62; and Green: ABCG2.
