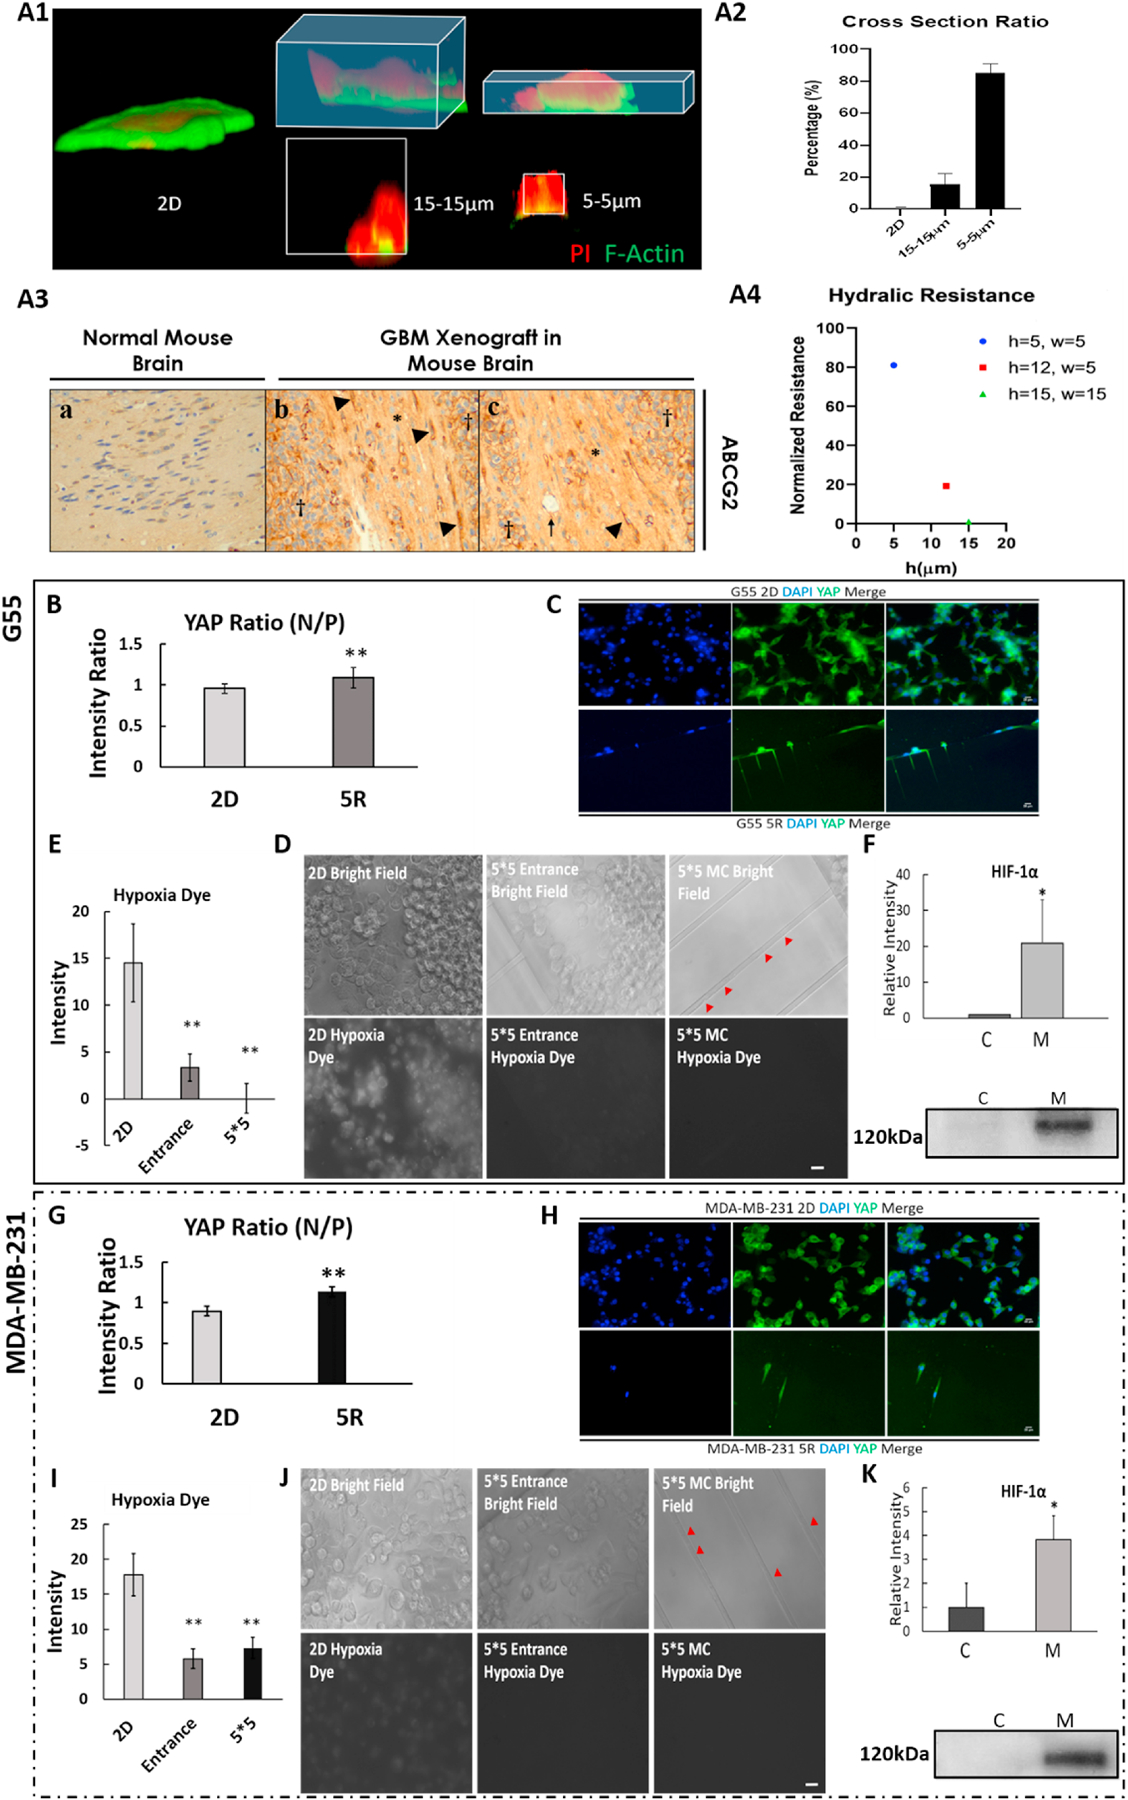
Fig. 5. Confined-migrating cancer cells exhibit increased cytoskeleton tension with minimal hypoxic stress.

A1. 3D reconstructed MDA-MB-231 cells under different degrees of confinement: 2D, 15×15 and 5×5 μm microchannel (Red: PI; Green: F-actin). A2. Cross section ratio of MDA-MB-231 cells inside microchannel. Average + Std, n=4/condition. (cross section ratio = cross section acreage of cell/cross section acreage of microchannel) A3. Immunohistochemical staining for ABCG2 in the G55 murine xenograft model of glioblastoma multiforme demonstrates high ABCG2 expression in migrating tumor cells within cortical white matter tracts. a: health mouse brain tissue (noncancerous). b-c: In areas bordering G55 tumors (labeled with †), elevated ABCG2 expression can be observed in the migrating tumor cells within cortical white matter tracts (labeled with*). Arrow: blood vessel. Arrowhead: tumor cells highly expressing ABCG2 in a whole cell pattern. A4. Hydraulic resistance inside microchannels with different dimensions. h: height; w: width. Results are normalized by the lowest resistance number (i.e., 15×15 μm microchannel). B and G. Quantitative comparison of YAP expression (N/P; nucleus/cytoplasm) between 2D cultured and confined-migrated cells. 5R: cells migrated through 5 × 5 μm microchannel. C and H. Representative YAP fluorescence images of G55 (C) and MDA-MB-231 (H) cells. Blue: DAPI; Green: YAP. Scale bar: 10μm. D and J. Representative hypoxia dye fluorescence images of cells in the central reservoir (2D), 5 × 5 μm entrance and inside 5 × 5 μm microchannels (MC). Red arrows indicate the confined-migrating cells via the 5 × 5 μm microchannels. E and I. Quantitative comparison of hypoxia dye intensity of the cells in different locations. F and K. Western blot HIF-1α relative intensity. C: 2D cultured cells and M: cells migrated through 5 × 12 μm microchannels. All results were normalized to the total proteins. Average + Std. *p<0.05, **p<0.01 between 2D and others. Scale bar: 5 μm. All experiments were reproduced.
