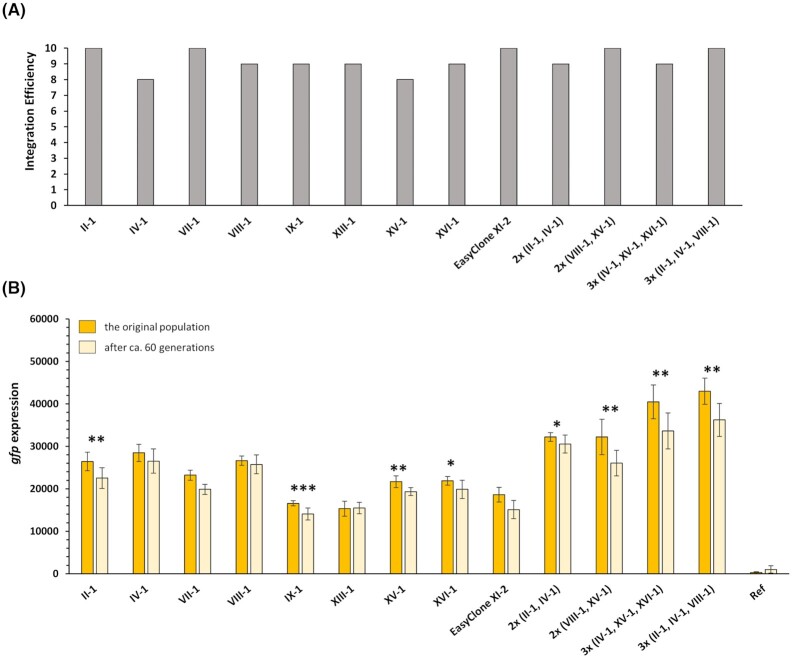
Figure 2.
Characterization of EasyClone-expanded integrative vectors. A) Transformation efficiency shown as number of clones with correctly integrated DNA out of 10 randomly picked clones. B) Expression level of Ptef1- gfp-Tadh1 integrated into the new sites for original fluorescent population and these cells after cultivation for ca. 60 generations. Expression from EasyClone site XI-2 is shown for comparisson. The reported values for fluorescence are the mean for 8–10 replicates, with error bars showing standard deviation between the replicates. Statistical analysis was performed for gfp expression values of each strain for original and 60th generations by using Student's t test (one-tailed, two-sample unequal variances; *p <0.05, **p <0.01, ***p <0.001).

