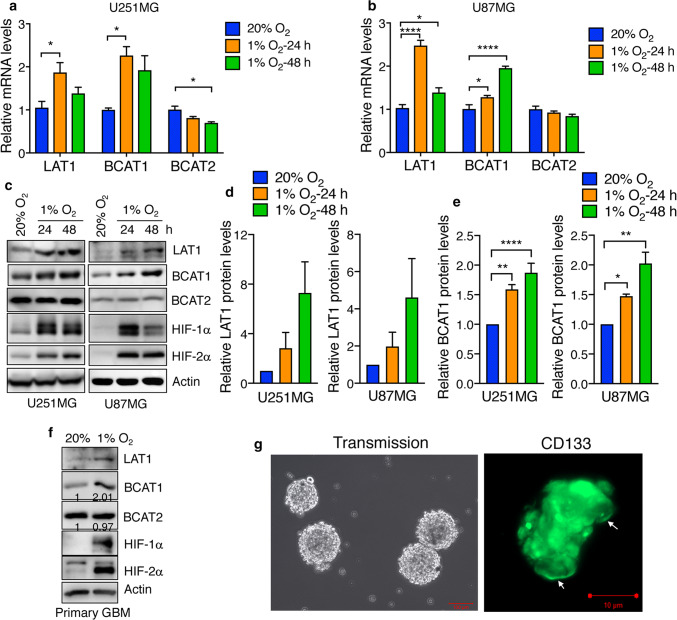
Fig. 1.
Hypoxia upregulates LAT1 and BCAT1, but not BCAT2, in human GBM cells. a, b RT-qPCR analysis of LAT1, BCAT1, and BCAT2 mRNAs in U251MG (a) and U87MG (b) cells exposed to 20% or 1% O2 for 24 or 48 h. Data are shown in mean ± SEM, n = 3–6. *p < 0.05; ****p < 0.0001 (One-way ANOVA). c–e Immunoblot analysis of indicated protein levels in U251MG (left) and U87MG (right) exposed to 20% or 1% O2 for 24 or 48 h. Representative blots from 3–6 independent experiments are shown in c. LAT1 (d), BCAT1 (e) and actin western blot bands were quantified by densitometry and the ratio of LAT1 and BCAT1 to actin was normalized to 20% O2 (mean ± SEM, n = 3–6). *p < 0.05; **p < 0.01; ****p < 0.0001 (One-way ANOVA). f Immunoblot analysis of indicated protein levels in primary human GBM cells exposed to 20% or 1% O2 for 48 h. Representative blots from two independent experiments are shown. Intensity of BCAT1 and BCAT2 western blots is quantified and normalized to 20% O2. g Primary GBM cells were stained with a mouse monoclonal anti-CD133 antibody followed by a donkey anti-mouse Cy2 antibody, fixed with 4% paraformaldehyde, and visualized by a Zeiss microscopy. Scale bar, 100 μm (left) and 10 μm (right)

