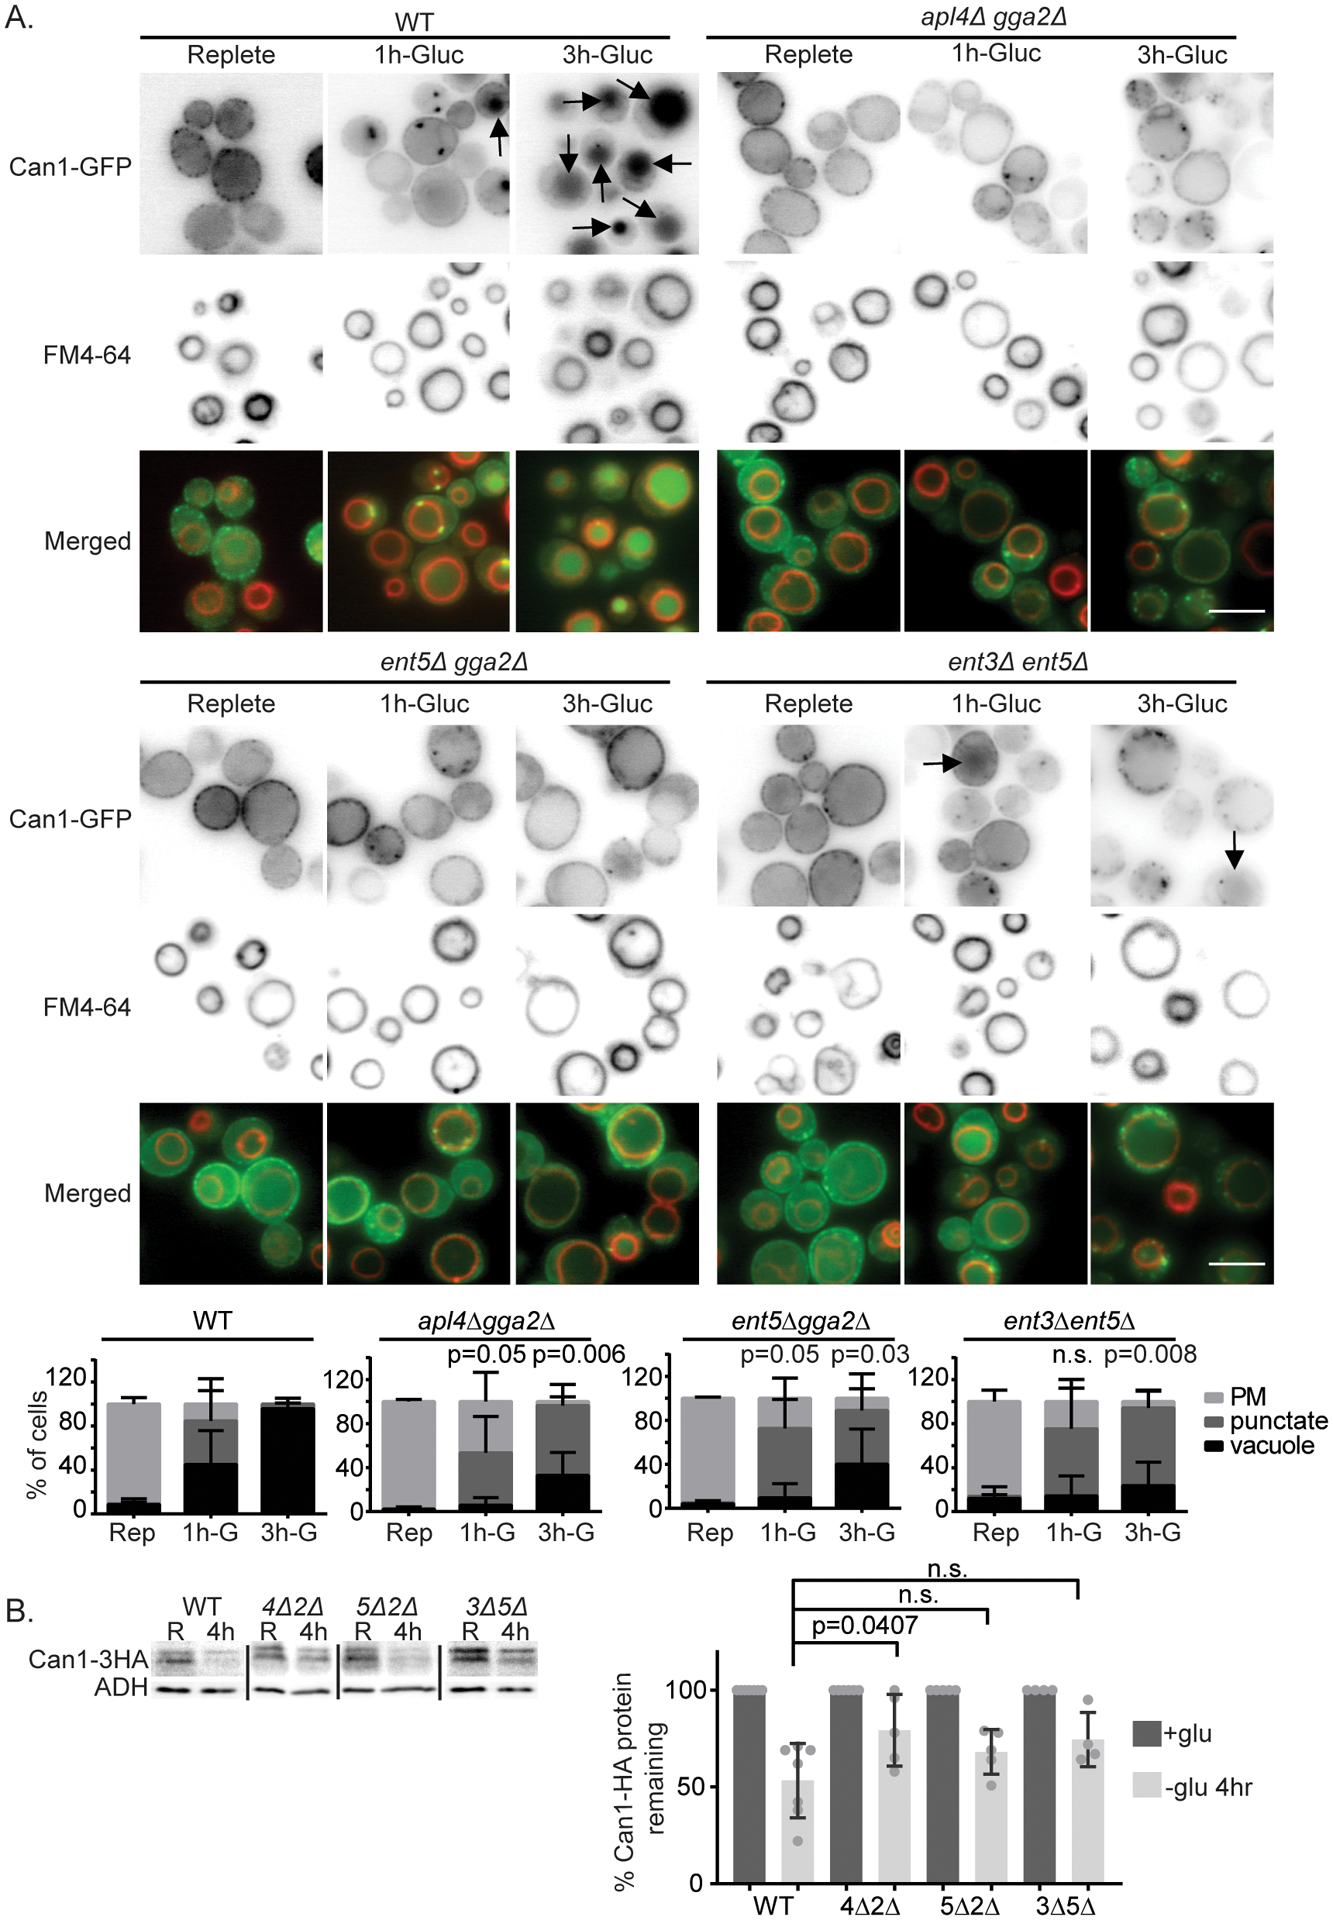
Figure 4.

TGN-localized clathrin adaptors are important for delivery of Can1 to the vacuole after glucose starvation. A) Indicated cells expressing Can1-GFP from a plasmid were imaged in synthetic complete media and 1 or 3 hr of continued glucose withdrawal. Arrows indicate vacuolar localization as identified by FM4–64 labeling. Bar is 5 μm. Chart shows quantification of cell classes and p-values as described in materials and methods, n=3. B) Can1-HA expressed from its endogenous locus was extracted from wild-type (WT), apl4Δgga2Δ (4Δ2Δ), ent5Δ gga2Δ (5Δ2Δ), or ent3Δ ent5Δ (3Δ5Δ) in replete media (R) and 4 hr after continued glucose withdrawal (30’). Image shows representative western blot probed for Can1-HA and lysis control ADH1. Charts show quantification of percent Can1-HA protein remaining at 30 min after continued arginine treatment, means with standard deviation are displayed, individual values are plotted. Values were normalized to Can1-HA before glucose withdrawal and lysis control ADH1. p-values were calculated using a two-tailed unpaired t-test for the null hypothesis that the average value was equal for mutant and wild-type cells.
