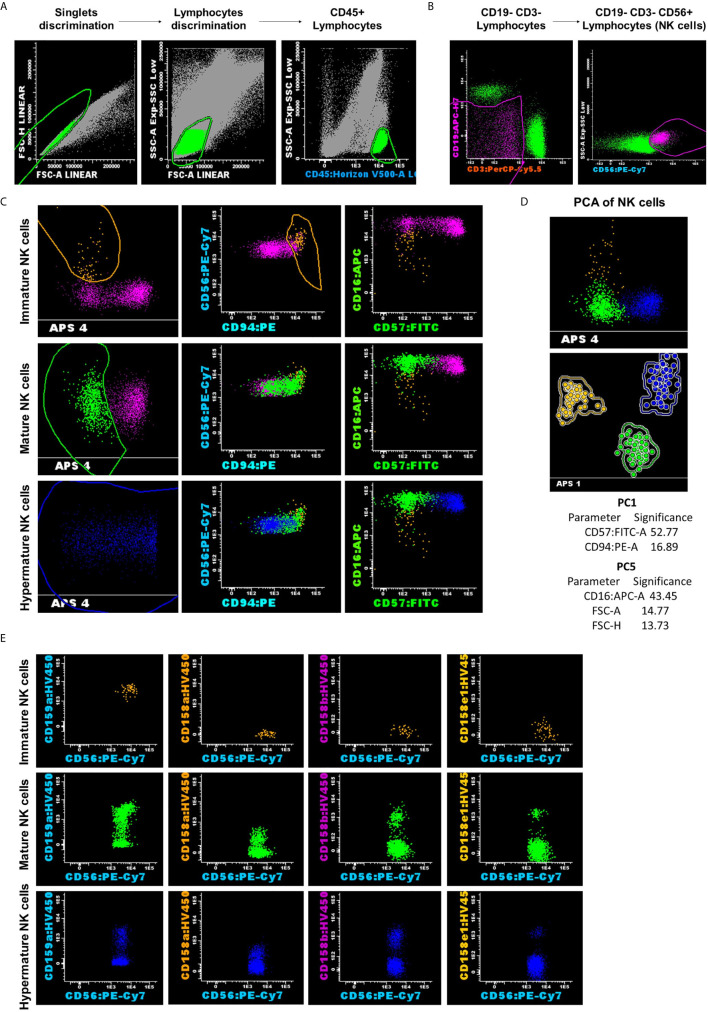
Figure 1.
Representative example for NK analysis strategy and classification into three subsets: CD56bright CD94hi CD16− CD57− as the immature subset (yellow dots); CD56dim CD94med CD16+ CD57− as the mature subset (green dots); and CD56dim CD94low CD16+ CD57+ as the hypermature subset (blue dots). (A) Lymphocytes gating on the side scatter (SSC) vs CD45 dot-plots. (B) NK cells were gated according to CD56 expression and the absence of CD3 and CD19. (C, D) Reliable separation of NK cells into subsets was obtained using the Principal Component Analysis (PCA) for all analyzed cases, regardless of the group. Dots and circles represent the median values of individual cases, and the solid line represents the 2 SD curve for an NK subset (yellow, CD56bright CD94hi CD16− CD57− represents the immature subset; green, CD56dim CD94med CD16+ CD57− represents the mature subset; and blue, CD56dim CD94low CD16+ CD57+ represents the hypermature subset). The table shows the contribution of the most relevant parameters (those markers that received a weight over 10) to the first (PC1, x-axis) or second (PC5, y-axis) principal component reflected as percent values. (E) Distribution of CD159a and KIR receptors inside of the different NK cell subpopulations for the presented case.

