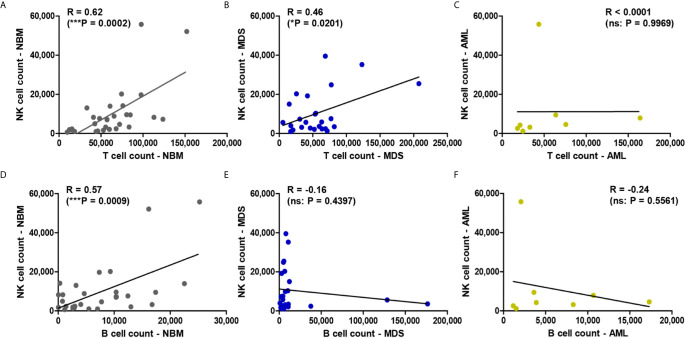
Figure 2.
Regression statistics describing the relationship between bone marrow NK, T, and B cell counts for the three case groups: NBM, MDS, and AML. Correlation coefficients (R) were computed for (A) NK and T cell counts in NBM cases (n = 30); (B) NK and T cell counts in MDS (n = 25); (C) NK and T cell counts in AML (n = 8); (D) NK and B cell counts in NBM cases (n = 30); (E) NK and B cell counts in MDS (n = 25); (F) NK and B cell counts in AML (n = 8). Data are presented as scatter plots. Spearman test was used to analyze the significance of the identified correlations (***P < 0.001, *P < 0.05, ns, not significant).

