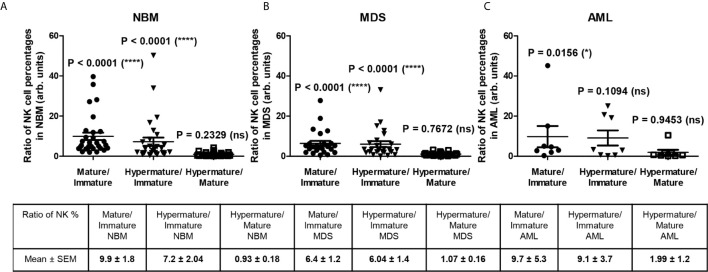
Figure 4.
Ratio of cell percentages in distinct NK maturation subsets within the bone marrow microenvironment of NBM, MDS, and AML cases. (A) Ratio of cell percentages for the indicated NK maturation subsets (mature to immature, hypermature to immature, and hypermature to mature) in normal bone marrow (NBM, n = 30) cases. Data are presented as scatter dot plots, and the lines represent the mean ± SEM (****P < 0.0001, ns, not significant; Wilcoxon signed rank test). (B) Ratio of cell percentages for the indicated NK maturation subsets (mature to immature, hypermature to immature, and hypermature to mature) in myelodysplastic syndromes (MDS, n = 25) cases. Data are presented as scatter dot plots, and the lines represent the mean ± SEM (****P < 0.0001, ns, not significant; Wilcoxon signed rank test). (C) Ratio of cell percentages for the indicated NK maturation subsets (mature to immature, hypermature to immature, and hypermature to mature) in acute myeloid leukemia (AML, n = 8) cases. Data are presented as scatter dot plots, and the lines represent the mean ± SEM (*P < 0.05, ns, not significant; Wilcoxon signed rank test).

