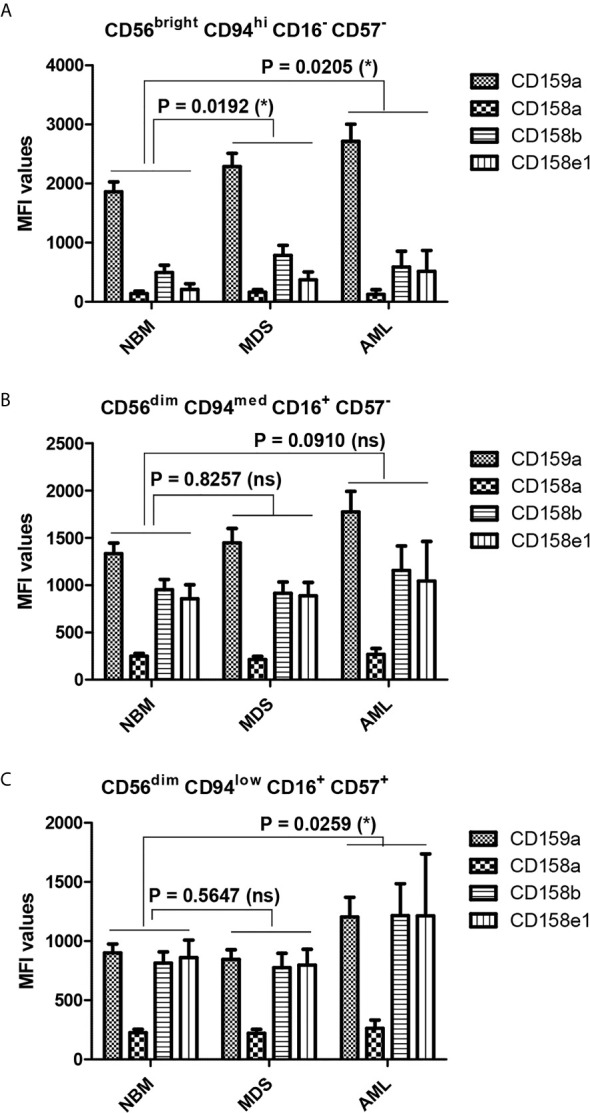
Figure 8.

Differences in the repartition of CD159a and KIR receptors in distinct NK maturation subsets within the bone marrow microenvironment of NBM, MDS, and AML cases. (A) Mean fluorescence intensity (MFI) of CD159a and KIR receptors on the surface of bone marrow CD56bright CD94hi CD16- CD57- immature NK cells in normal bone marrow (NBM, n = 30), myelodysplastic syndromes (MDS, n = 25), and acute myeloid leukemia (AML, n = 8) cases. Bars represent the mean ± SEM (*P < 0.05; two-way ANOVA followed by Bonferroni post-test). (B) Mean fluorescence intensity (MFI) of CD159a and KIR receptors on the surface of marrow CD56dim CD94med CD16+ CD57- mature NK cells in NBM (n = 30), MDS (n = 25), and AML (n = 8) cases. Bars represent the mean ± SEM (ns, not significant; two-way ANOVA followed by Bonferroni post-test). (C) Mean fluorescence intensity (MFI) of CD159a and KIR receptors on the surface of bone marrow CD56dim CD94low CD16+ CD57+ hypermature NK cells in NBM (n = 30), MDS (n = 25), and AML (n = 8) cases. Bars represent the mean ± SEM (*P < 0.05; two-way ANOVA followed by Bonferroni post-test).
