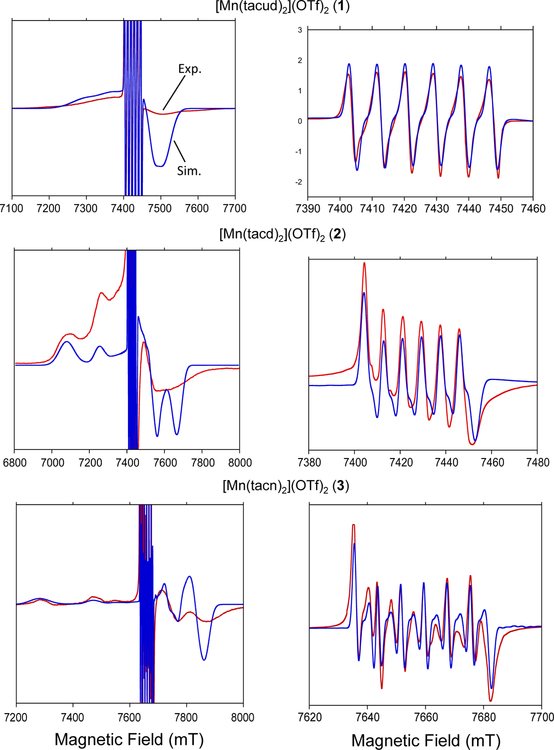
Fig. 7.
High field EPR (red) with simulation (blue) for each complex. Full spectrum with g = 2 region clipped is shown on the left; g = 2 region exclusively is shown on the right. Simulation parameters are as follows: 1, g = 2.0013, A = 244 MHz, D = −930 MHz, Dstrain = 600 MHz; 2, g = 2.0008, A = 233 MHz, D = −2470 MHz, E = 300 MHz, Dstrain = 600 MHz; 3, g = 2.00028, A = 223 MHz, D = −2650 MHz, Dstrain = 500 MHz. Data for complexes 1 and 2 were collected at 208 GHz. Data for complex 3 was collected at 214.4 GHz. Spectra presented were recorded at 5K.

