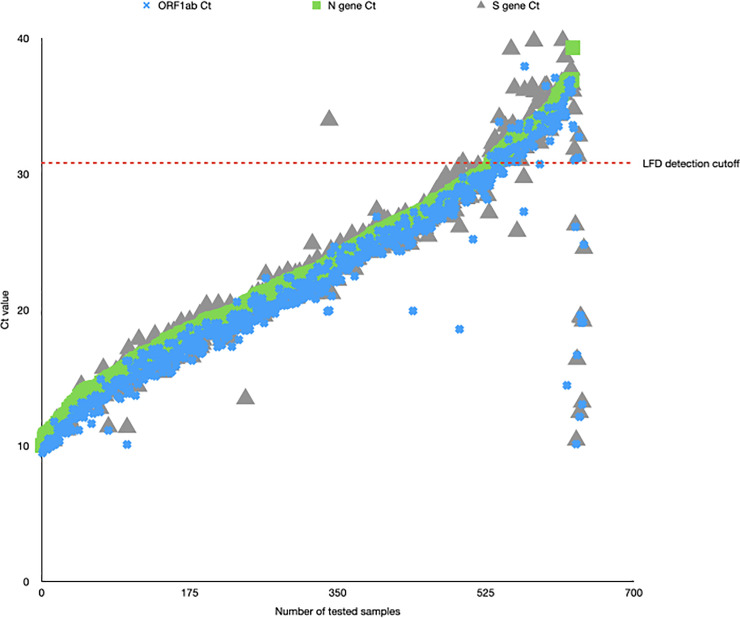
Fig 2. Graph plotting raw Ct values (y-axis) for all 641 positive samples in the Birmingham Turnkey lab (y-axis).
Ct values for each of the targets (Orf1, N, S) are plotted, with a sample only called positive if at least 2 of the 3 targets have a Ct <35. The red line indicates the N gene Ct value equating to 100 viral copies/ml, the previously determined LoD for the Innova LFD. Ct, cycle threshold; LFD, Lateral Flow Device; LoD, Limit of Detection.

