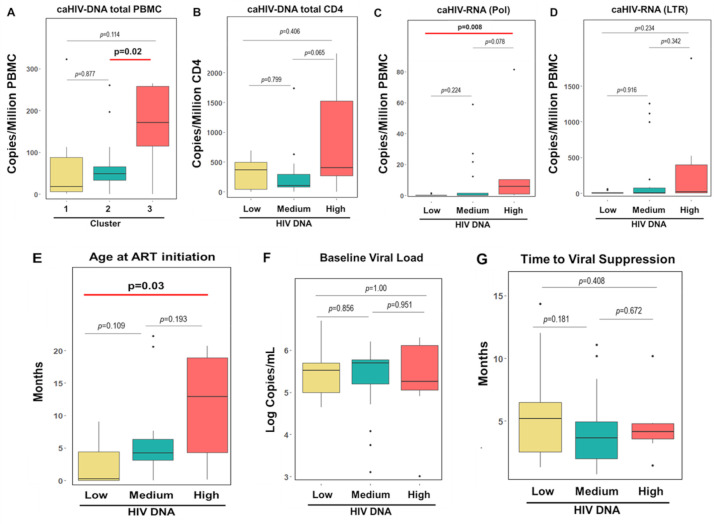
Fig 5. Clinical and virological characteristics of the 3 clusters based on the immunological predictors identified by the penalized regression.
Evaluation of: A) HIV DNA copies per million PBMC in the 3 clusters. Clusters are depicted in yellow (cluster 1), green (cluster 2) and red (cluster 3). Based on the distribution of HIV DNA in the 3 clusters we renamed them in: Low (cluster 1), Medium (cluster 2) and High (cluster 3) HIV DNA, B) HIV DNA copies per million CD4 T cells in the 3 clusters, C) unspliced cell associated HIV RNA (pol), D) total cell associated HIV RNA (LTR), E) Age at treatment initiation, F) Baseline viral load and G) Time to achieve viral suppression. Box and whiskers graphs were chosen to show median and interquartile. Outliers are also shown using black dots. P values for the significant comparison are reported in bold.

