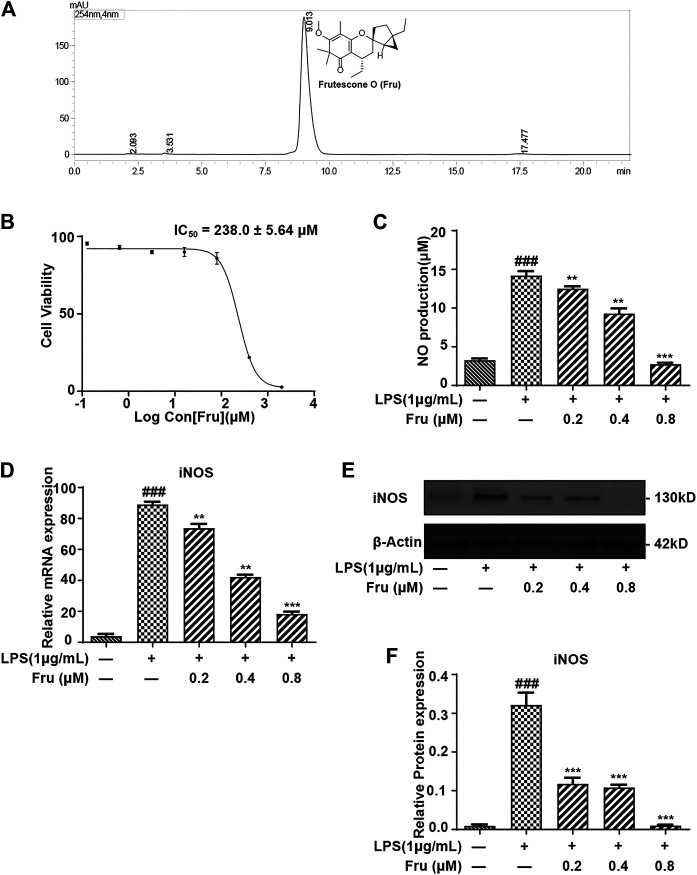
FIGURE 1.
Fru suppressed the production of NO in LPS induced RAW264.7 cells. (A) Structure and HPLC chromatogram of Fru isolated from Baeckea frutescens L. The purity of Fru was determined to be over 98% by normalization of the peak area detected by HPLC-UV. (B) Effect of Fru on cell viability of RAW264.7 cells. Cells were incubated with Fru (0.1–2000 μM) for 24 h. Cell viability was evaluated by the Alamar Blue assay. (C) Fru suppressed the production of NO in LPS-induced RAW264.7 cells. Cells were incubated with different concentrations of Fru (0.2, 0.4, and 0.8 μM) and 1 μg/ml LPS for 18 h. NO production in the cell culture supernatant was detected by the Griess assay. (D) Effect of Fru on iNOS mRNA expression. Relative mRNA expression levels of iNOS were measured with qRT-PCR and normalized to GAPDH. (E, F) Effects of Fru on iNOS protein expression. The expression of iNOS was determined with Western Blot analysis. β-actin was used as the internal control. Quantitative data was represented as mean ± SD (n = 3, ### p < 0.001 vs. Control; **p < 0.01, ***p < 0.001 vs. LPS).

