FIGURE 6.
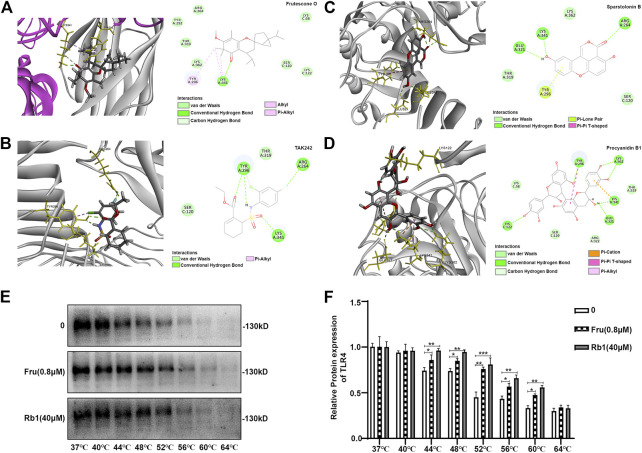
Molecular docking of Frutescone O on TLR4-MD2 complex. (A) The close-up view and 2D view of the sites of Fru in the TLR4-MD2 complex. (B) The close-up view and 2D view of the sites of TAK242 in the TLR4-MD2 complex. (C) The close-up view and 2D view of the sites of Sparstolonin B in the TLR4-MD2 complex. (D) The close-up view and 2D view of the sites of Procyanidin B1 in the TLR4-MD2 complex. (E, F) The binding study of TLR4 with Fru (0.8 μM) by cellular thermal shift assay. Rb1 (40 μM) served as the positive control and 0 the negative control. Quantitative data was represented as mean ± SD (n = 3, *p < 0.05, **p < 0.01, ***p < 0.001 vs. negative control).

