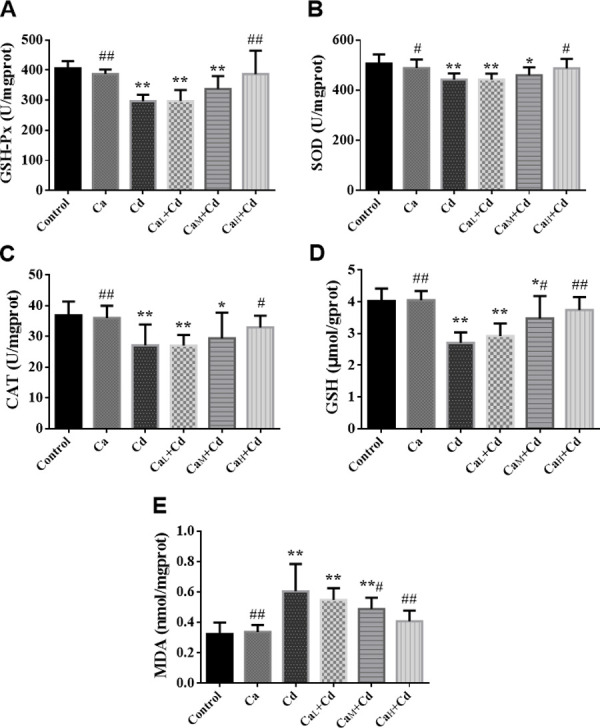
Fig 3.

The activity of GSH-Px (A), SOD (B) and CAT (C) and the content of GSH (D) and MDA (E) of liver in different groups. The data are shown as mean ± SD. * P < 0.05, compared with control-group. ** P < 0.01, compared with control-group. # P < 0.05, compared with Cd-group. ## P < 0.01, compared with Cd-group.
