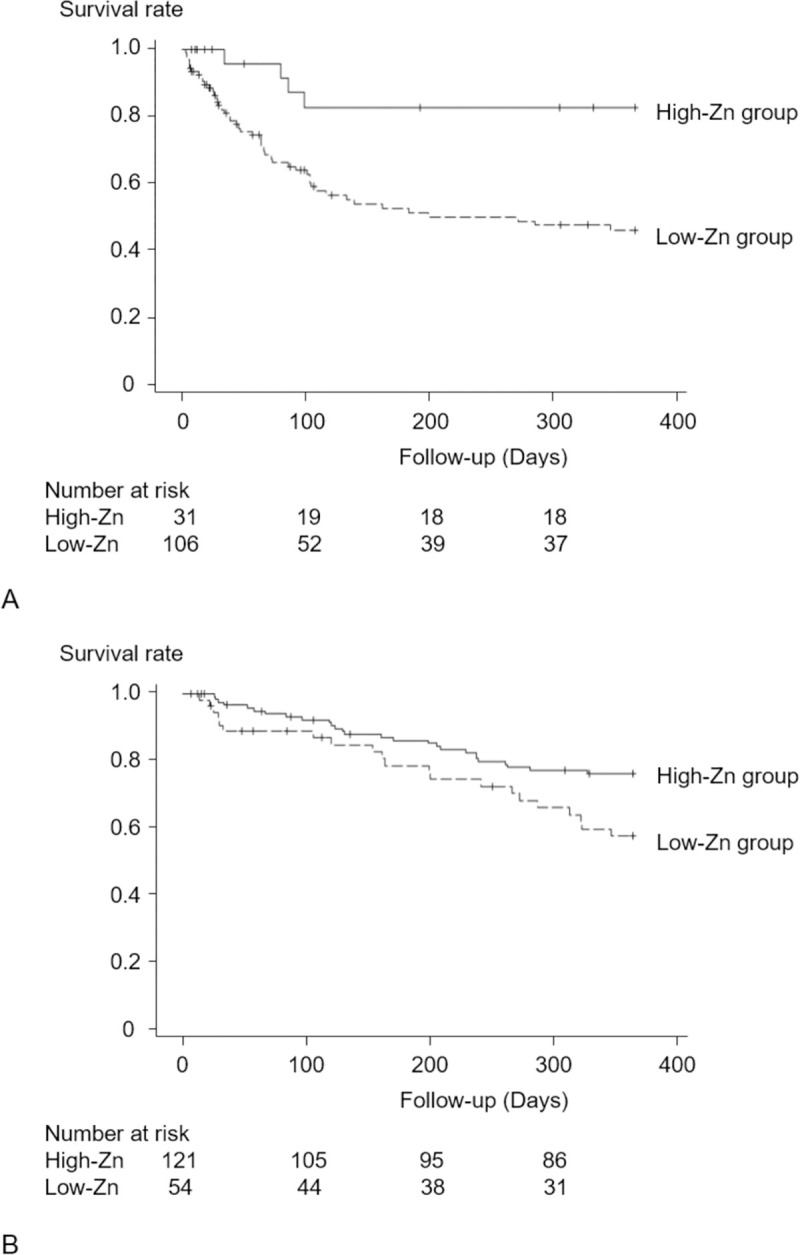
Fig 5. Survival rates in the subgroups classified by serum albumin levels.

Kaplan-Meier curves for the primary outcome over 1 year. (A) Patients with low serum albumin levels (<3.2 g/dl). (B) Patients with high serum albumin levels (≥3.2 g/dl). Survival rates were compared between the two groups by the log-rank test. The survival rate was lower in the low-Zn group than in the high-Zn group (A, log-rank test, p = 0.003; B, log-rank test, p = 0.020).
