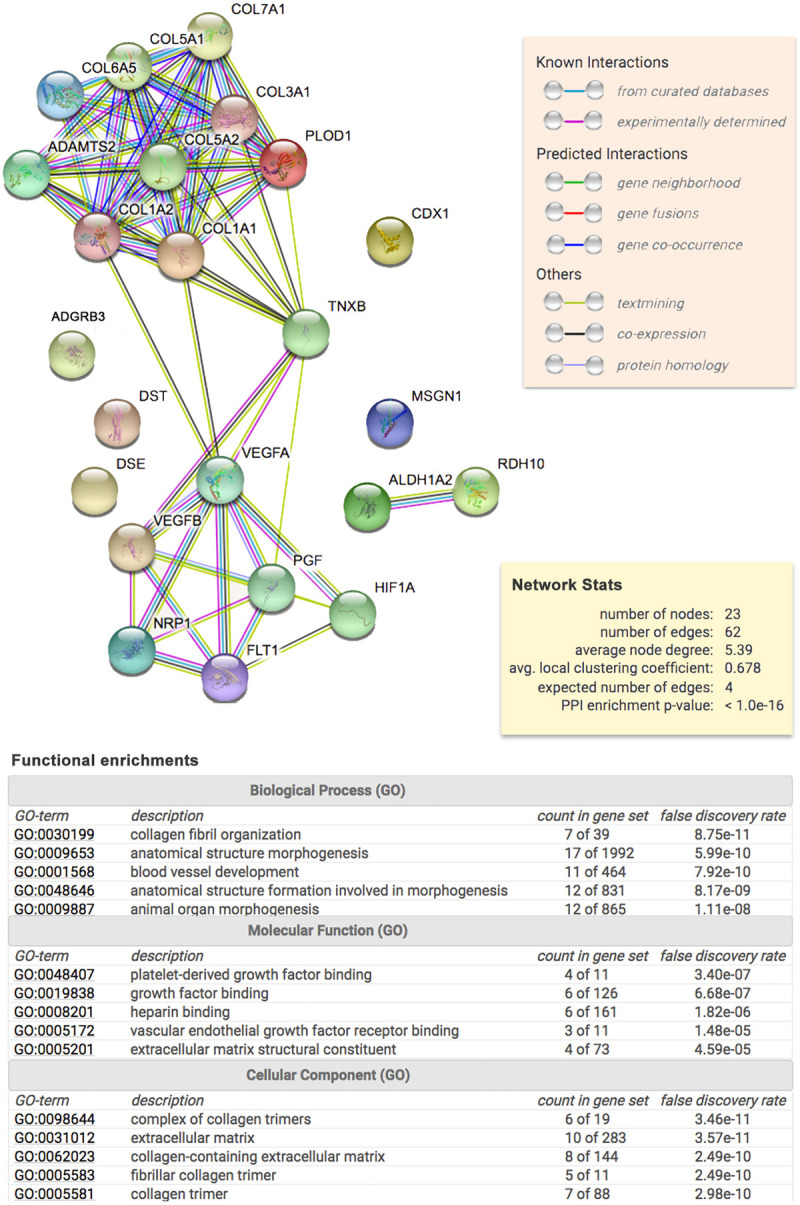
Fig 2. Protein network and enrichment analysis obtained from STRING.

In the upper part, the diagram shows the result obtained upon entering a set of 23 proteins suspected to be involved in CM-1. Each node represents all the proteins produced by a single, protein-coding gene locus. Colored nodes indicate query proteins and first set of interactions. Filled node content indicates that protein 3D structure is known/predicted. Edges represent specific and meaningful protein-protein associations. In the middle, the yellow rectangular shows the reported enrichment of functional connections among the set of proteins. At the bottom, the table shows the statistical enrichment detected in functional subsystems.
