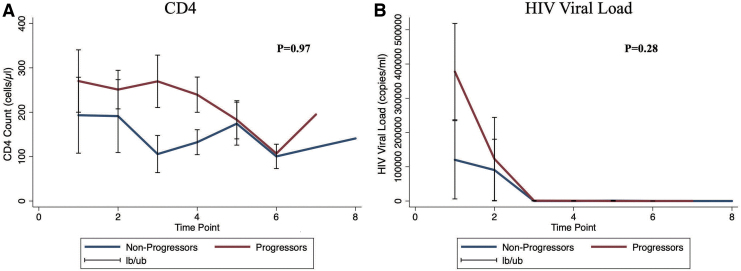
FIG. 2.
Longitudinal changes in CD4 counts (A) and HIV viral loads (B), and comparisons between progressors and nonprogressors. The lb/ub indicates 95% confidence intervals. On the x-axis are the time points that indicate when the patients presented, irrespective of the actual month/duration. Color images are available online.

