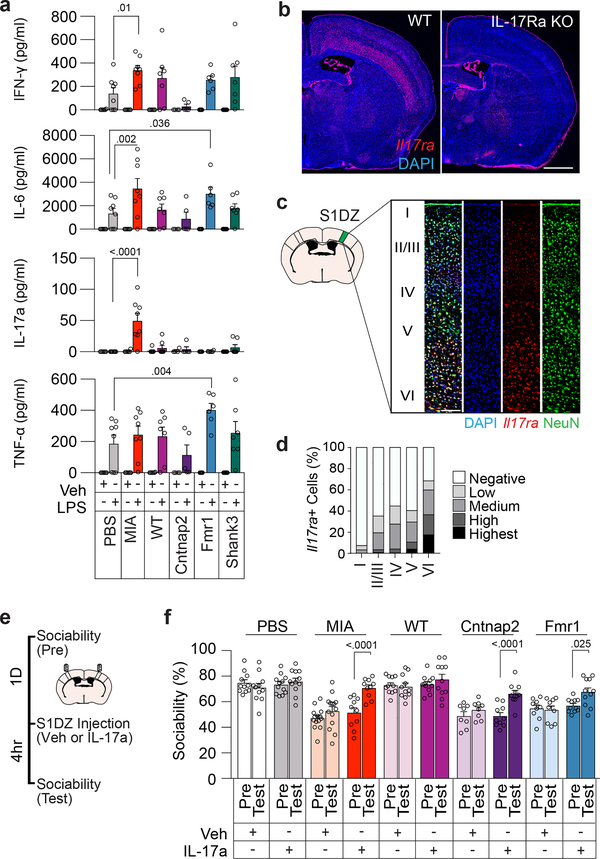
Figure 3. IL-17a rescues sociability deficits in both MIA offspring and monogenic mutant mice.
a, IFN-γ, IL-6, IL-17a, and TNF-α levels in plasma following Veh or LPS injection (PBS-Veh n=6, PBS-LPS n=8, MIA-Veh n=6, MIA-LPS n=8, WT-Veh n=6, WT-LPS n=7, Cntnap2-Veh n=4, Cntnap2-LPS n=5, Fmr1-Veh n=5, Fmr1-LPS n=6, Shank3-Veh n=7, Shank3-LPS n=7; from 3 independent experiments). b, Il17ra expression in WT and IL-17Ra KO animals at AP −0.58mm from 1 independent experiment. Scale bar represents 1mm. c, Co-labeling of Il17ra and NeuN in the S1DZ from 2 independent experiments. Scale bar represents 100μm. d, Quantification of Il17ra expression within the S1DZ according to cortical layer in PBS offspring (n=8; from 2 independent experiments). e,f, Mice were tested for sociability one day prior to injection (Pre) and following bilateral administration of Veh or IL-17a into the S1DZ (Test). (PBS-Veh n=11, PBS-IL-17a n=12, MIA-Veh n=14, MIA-IL-17a n=10, WT-Veh n=11, WT-IL-17a n=11, Cntnap2-Veh n=8, Cntnap2-IL-17a n=10, Fmr1-Veh n=9, Fmr1-IL-17a n=11; from 6 independent experiments). Statistics calculated by two-way ANOVA with Dunnett’s post-hoc test (a) and two-way repeated measures ANOVA with Sidak’s post-hoc test (f). Graphs indicate mean ± s.e.m.

