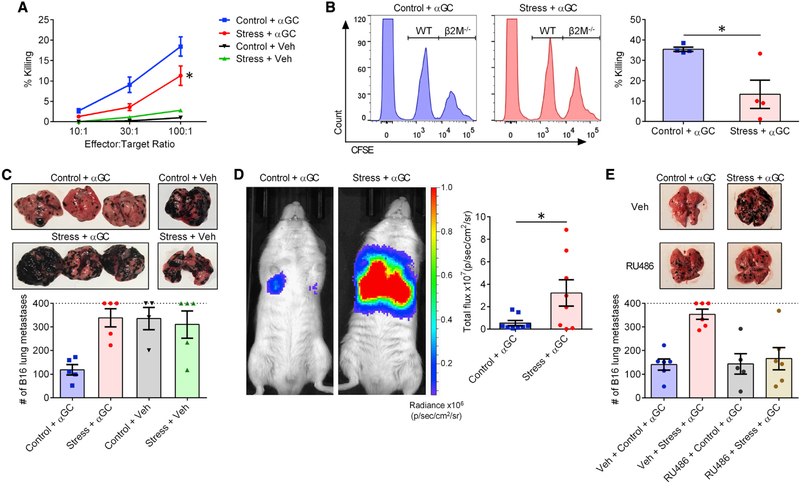
Figure 6. GR signaling during stress compromises the ability of iNKT cells to trigger oncolytic and antimetastatic responses.
B6 mice were restrained or left undisturbed before they were given αGC (n = 6 or 7) or Veh (n = 2).
(A) Twenty-four hours later, mice were euthanized, and their splenocytes were employed at the indicated effector:target ratios against 51Cr-labeled YAC-1 lymphoma cells. Percent specific cytotoxicity was calculated as described in STAR Methods.
(B) Twenty-four hours after αGC administration, previously stressed and control mice were injected i.v. with a 1:1 mixture of CFSElo WT B6 and CFSEhi β2M−/− B6 splenocytes. After 2 h, the relative proportion of each population was determined by flow cytometry, and percent cytotoxicity against NK-susceptible β2M−/− target cells was calculated as described in STAR Methods.
(C) In separate experiments, 6 h after αGC (or Veh) administration, mice were injected i.v. with B16-F10 cells. Lungs were photographed 14 days later for representative images, and metastatic lung nodules were visually counted as a measure of tumor burden. Mice bearing too many nodules to count (>400) are conservatively represented on the dotted line.
(D) In similar experiments, B6 albino mice received B16-FLuc cells. Twenty-one days later, they received an i.p. injection of luciferin and were subjected to whole-body bioluminescence imaging.
(E) In additional experiments, B6 mice were used as in (C) except they were injected i.p. with RU486 (or Veh) 1 h before they were restrained (or not).
Each symbol in (B)–(E) represents a mouse. Error bars denote SEM. * denotes a difference with p < 0.05 by two-way ANOVA with Tukey’s correction (A) or by unpaired Student’s t tests (B and D).

