Fig. 3.
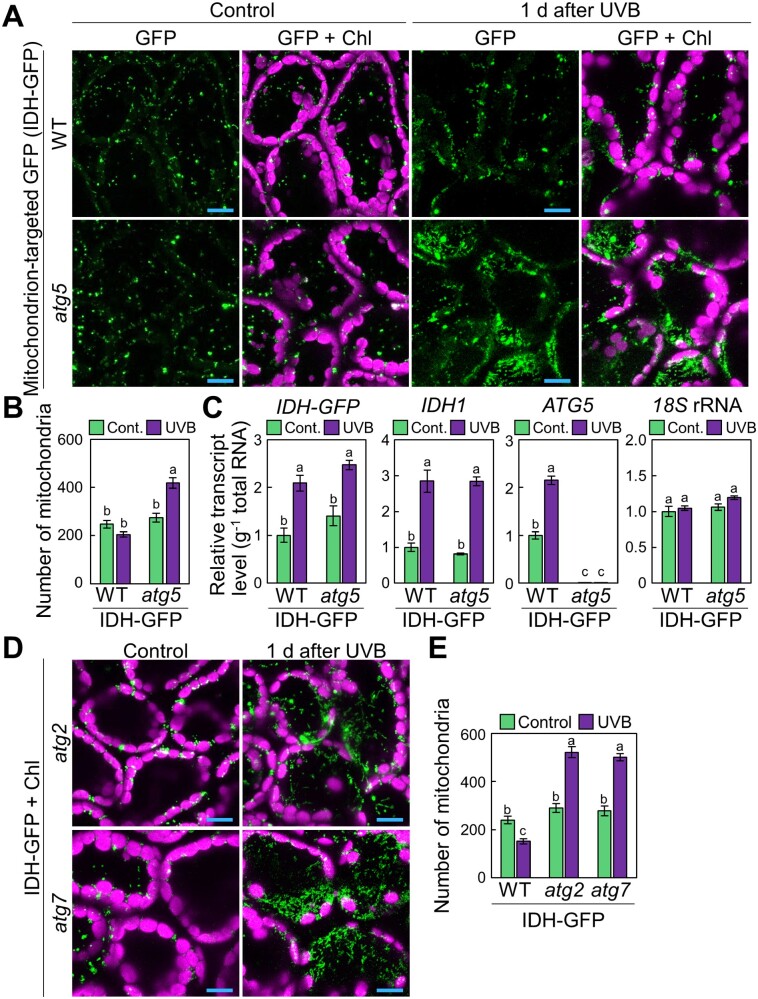
Autophagy deficiency causes an increase in mitochondrial population in UVB-damaged leaves. (A) Confocal images of mesophyll cells expressing mitochondrion-targeted isocitrate dehydrogenase-GFP (IDH-GFP) from WT and atg5 untreated control plants or plants 1 d after a 1-h UVB (1.5 W m−2) exposure. (B) Mean numbers of mitochondria obtained from the three-dimensional images described in (A) (� SE, n = 4). (C) Transcript levels for IDH-GFP, IDH1 and ATG5 in leaves of WT and atg5 untreated control plants or plants 1 d after a 1-h UVB exposure (� SE, n = 3). Transcript levels of the respective genes are shown relative to the values from WT control leaves, which are set to 1. The level of 18S rRNA was measured as an internal control. (D) Confocal images of mesophyll cells expressing IDH-GFP from atg2 and atg7 untreated control plants or plants 1 d after a 1-h UVB exposure. (E) Number of mitochondria obtained from the three-dimensional images described in (D) (� SE, n = 4). For confocal images, orthogonal projections created from z-stack images are shown. Green, GFP; magenta, chlorophyll autofluorescence (Chl). Scale bars = 10 �m in each image. Different letters in each graph denote significant differences based on Tukey’s test (P < 0.05).

