Fig. 5.
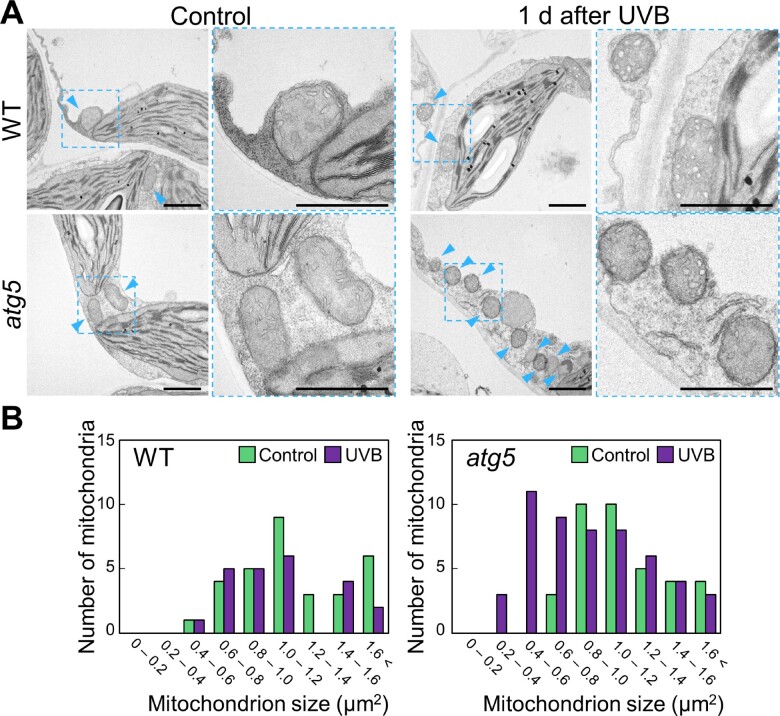
Electron microscopy of the cytoplasmic accumulation of small mitochondria in UVB-damaged atg5 leaves. (A) Transmission electron micrographs from mesophyll cells of WT and atg5 untreated control plants or plants 1 d after UVB exposure (1.5 W m−2) for 1 h. Blue arrowheads indicate mitochondria in cytoplasm. Scale bars = 2 �m. The area indicated by a dashed blue box is expanded to the right of each panel. (B) Histograms showing the distribution of mitochondrial sizes obtained from the TEM images in (A).

