Fig. 6.
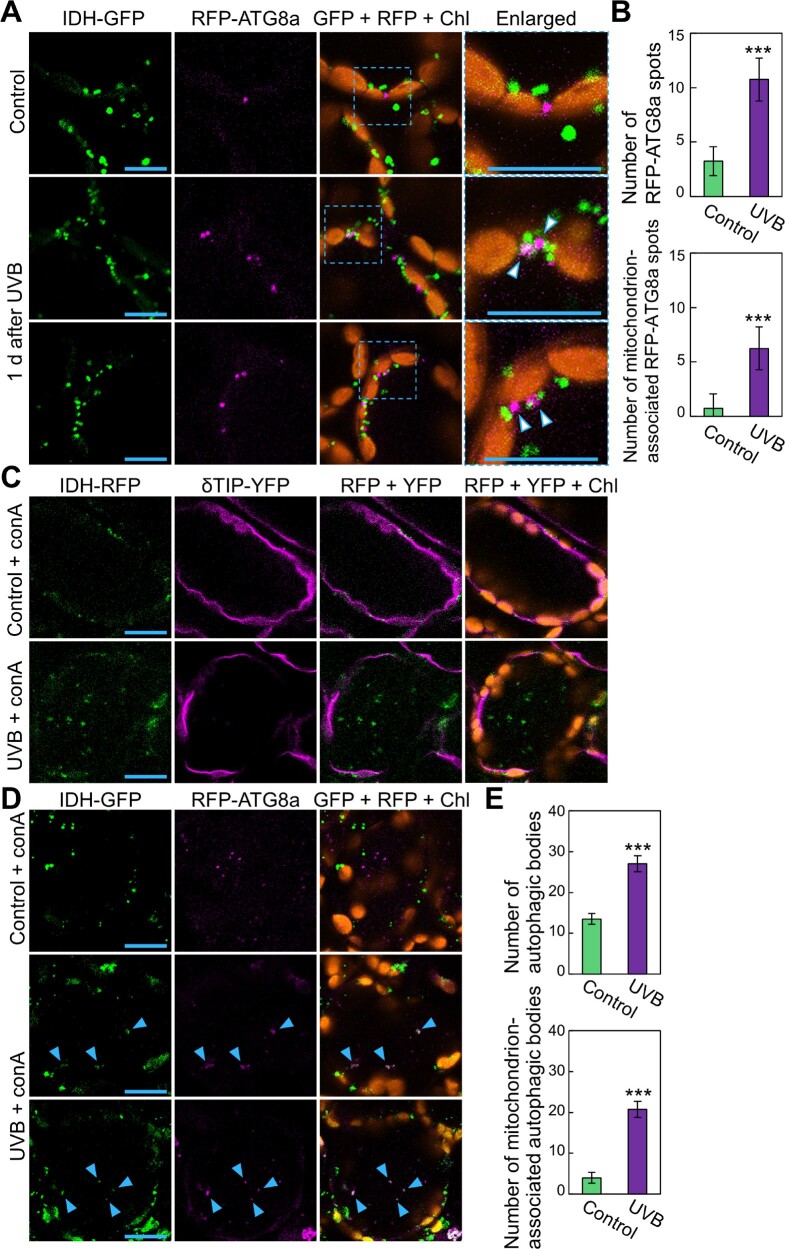
UVB damage activates autophagosome-mediated transport of mitochondria to the central vacuole. (A) Confocal images of mesophyll cells expressing mitochondrial IDH-GFP and autophagosomal RFP-ATG8a from untreated control plants or plants 1 d after a 1-h UVB (1.5 W m−2) exposure. Green, IDH-GFP; magenta, RFP-ATG8a; orange, chlorophyll autofluorescence (Chl). For UVB treatment, two representative images are shown. (B) Number of autophagic structures (top) and mitochondrion-associated autophagic structures (bottom) from (A) (� SE, n = 4). (C) Confocal images of mesophyll cells expressing mitochondrial IDH-RFP and the tonoplast membrane marker δTIP-YFP from ConA-treated leaves. Leaves of untreated control plants or plants immediately after a 1-h UVB exposure were subjected to a 1-d incubation with ConA. Green, IDH-RFP; magenta, δTIP-YFP; orange, chlorophyll autofluorescence. (D) Confocal images of mesophyll cells expressing mitochondrial IDH-GFP and autophagosomal RFP-ATG8a from ConA-treated leaves. Leaves of untreated control plants or plants immediately after a 1-h UVB (1.5 W m−2) exposure were subjected to a 2-d incubation with ConA. Green, IDH-GFP; magenta, RFP-ATG8a; orange, chlorophyll autofluorescence (Chl). For UVB treatment, two representative images are shown. Blue arrowheads indicate mitochondria colocalized with autophagosomal RFP-ATG8a signals in the vacuole. (E) Number of autophagic bodies (top) and mitochondrion-associated autophagic bodies (bottom) from (D) (� SE, n = 4). Throughout, scale bars = 10 μm; asterisks denote significant differences between control and UVB-treated plants based on Student’s t-test (***P < 0.001). The area indicated by a dashed blue box is expanded to the right of each panel.

