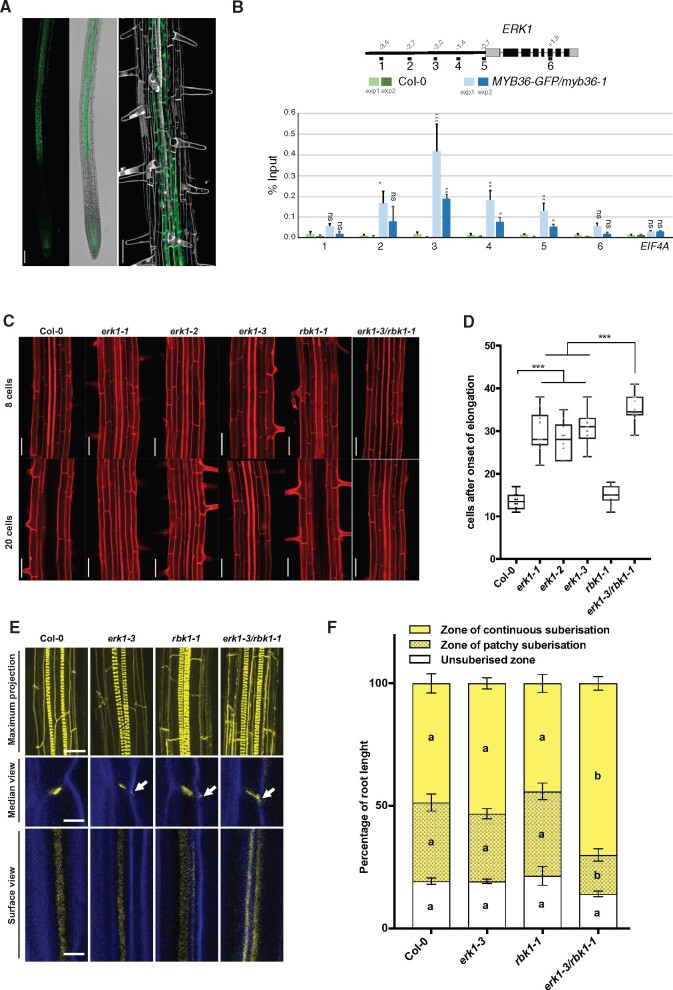
Fig. 1.
Loss of CS integrity and disruption of the apoplastic barrier in erk1 and rbk1 mutants. (A) Confocal microscopy images of roots expressing ERK1–GFP. Cell walls stained with propidium iodide (grey). Bar = 200 �M. (B) Chromatin immunoprecipitation shows that MYB36 binds the promoter of ERK1 (n = 3). EIF4A was used as control. ChIP-qPCR data are shown as means � S.D from 3 technical replicates. Student's t-test, *P <0.1, **P<0.05, ***P<0.001 and n.s. indicate no significance. (C) Lack of endodermal diffusion barrier in erk1 and rbk1 mutants visualized by presence of propidium iodide (red) in stele. Bar = 50 �M. (D) Quantification of PI penetration into the stele quantified as number of endodermal cells from the first fully expanded cell (n = 10). Differences between groups were determined by paired t-test, ***P < 0.001. (E) Three-dimensional maximum projections of CS autofluorescence. Spiral structures in the center of the root are xylem (top). Longitudinal section of lignin deposition sites (bottom). Cleared roots were stained with basic fuchsin (yellow; lignin) and Calcofluor White (blue; cellulose). Although both of these dyes stain cell walls, basic fuchsin primarily interacts with lignin and Calcofluor White with cellulose. White arrows indicate the dispersed deposition of lignin at the CS. (F) Quantitative analysis of suberin accumulation. Suberin was stained with fluorol yellow 088. The endodermal cell suberin was counted from the onset of elongation to the junction (base) between root and hypocotyl (n = 6). Individual letter shows significant differences using Mann–Whitney test between the same zones (P < 0.01).

