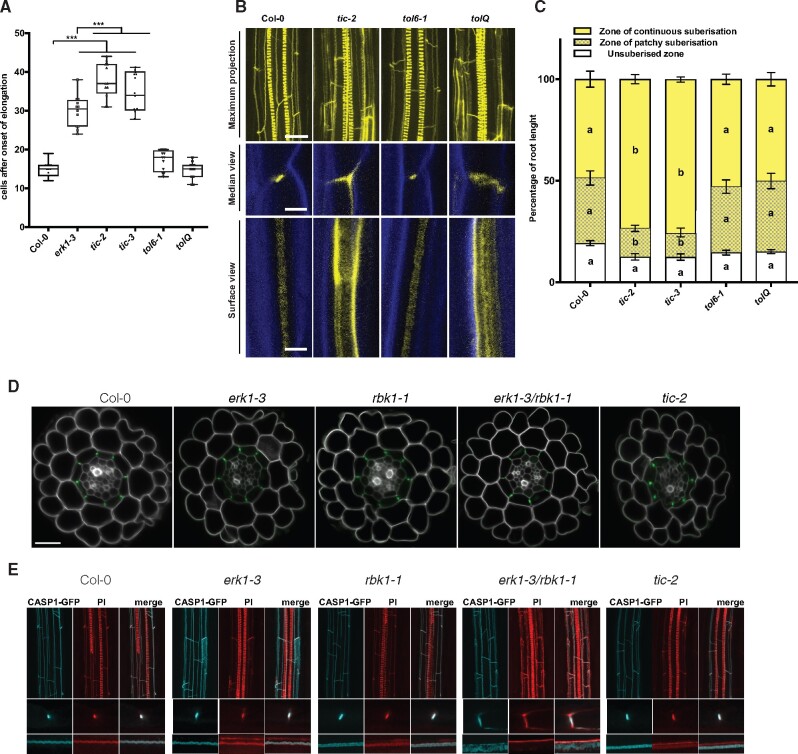
Fig. 2.
TIC and TOL are downstream targets of the ERK1 signaling pathway implicated in Casparian Strip formation. (A) Quantification of PI penetration into the stele quantified as number of endodermal cells from the first fully expanded cell (n = 10). Differences between groups were determined by paired t-test, ***P < 0.001. (B) Three-dimensional maximum projections of CS autofluorescence. Spiral structures in the center of the root are xylem (top). Longitudinal section of lignin deposition sites (bottom). Cleared roots were stained with basic fuchsin (yellow; lignin) and Calcofluor White (blue; cellulose). (C) Quantitative analysis of suberin accumulation. Suberin was stained with fluorol yellow 088. The endodermal cell with suberin was counted from the onset of elongation to the junction (base) between root and hypocotyl (n = 6). Individual letter shows significant differences using Mann–Whitney test between the same zones (P < 0.01). (D) Confocal microscopy images of cross-section from roots expressing CASP1–GFP. Cell walls stained with PI (grey). Bar = 20 �M. (E) Three-dimensional maximum projections of the mature endodermis expressing CASP1–GFP and stained with basic fuchsin (lignin, red) (top) on cleared roots. Median and surface view of mature endodermal cells expressing CASP1–GFP and stained with basic fuchsin (bottom). White arrows indicate dispersed localization of CASP1-GFP and lignin.

