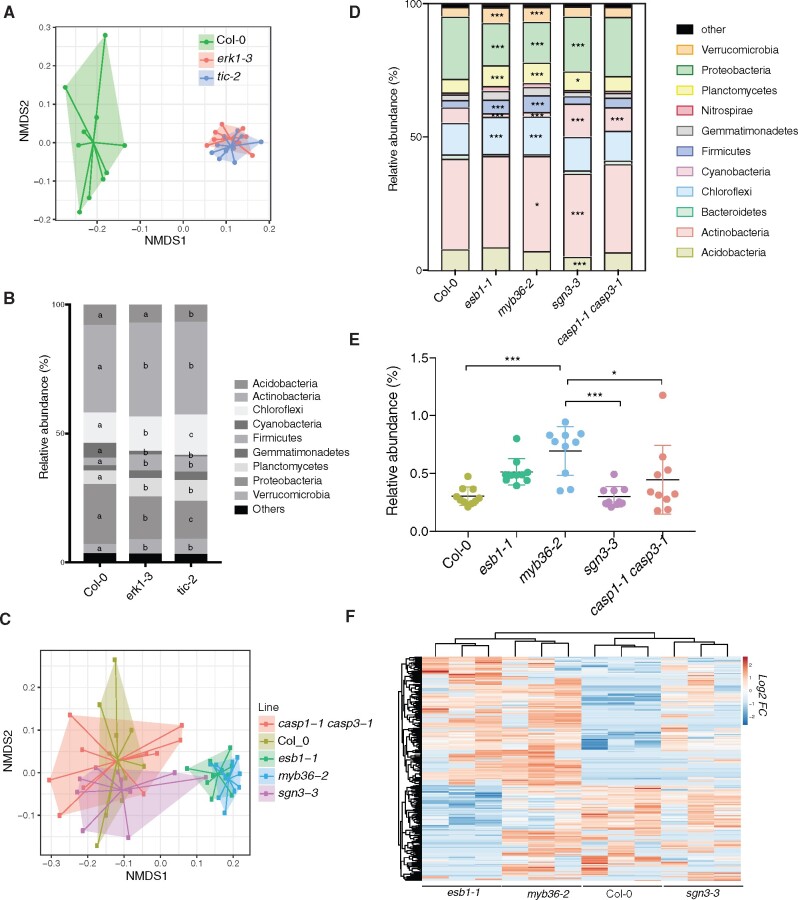
Fig. 4.
Differences in rhizosphere microbial community present in erk1-3, tic-2 and other CS mutants. (A) Principal component analysis (PCA) of Bray-Curtis distances of bacterial communities present in roots of Col-0, erk1-3 and tic-2 plants grown in natural soils (n = 10). (B) Distribution of soil bacteria in roots of Col-0, erk1-3 and tic-2 plants (n = 10). Individual letter shows significant differences using Mann–Whitney test between the same zones (P < 0.01). (C) PCA of Bray-Curtis distances of bacterial communities present in roots of Col-0, casp1-1; casp3-1, esb1-1, myb36-2 and sgn3-3 plants grown in natural soils (n = 10). Asterisks shows significant differences using Mann–Whitney test between the same zones (P < 0.01). (D) Distribution of soil bacteria in roots of Col-0, casp1-1; casp3-1, esb1-1, myb36-2 and sgn3-3 plants. Asterisks shows significant differences using Mann–Whitney test between the same zones (*P < 0.01, ***P < 0.0001). (E) Colonization assay with Bacillus amilloliquefaciens in roots of Col-0, casp1-1; casp3-1, esb1-1, myb36-2 and sgn3-3 plants. (F) Unsupervised hierarchical cluster heatmap analysis of metabolites exudated from roots of Col-0, esb1-1, myb36-2 and sgn3-3 plants. FC, fold change.

