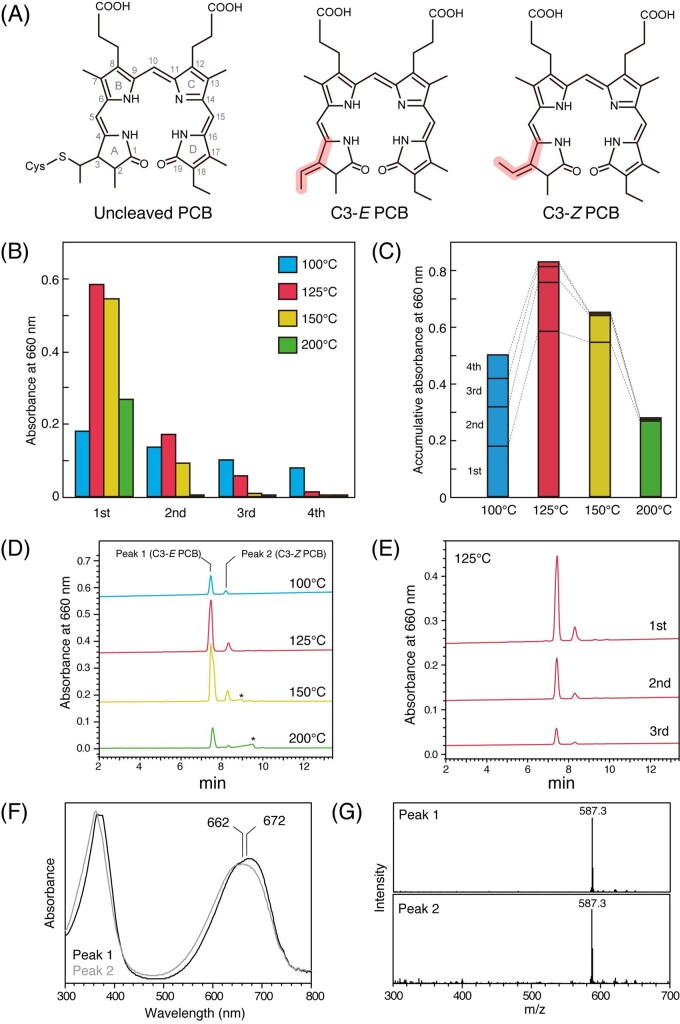
Fig. 2.
PLE of PCB from Lina Blue. (A) Structures of PCB covalently linked to denatured phycobiliproteins (left), C3-E PCB (center) and C3-Z PCB (right). The C3-E and C3-Z structures are shown in red. (B) Absorbance at 660 nm of PCB isolated from the 1st, 2nd, 3rd and 4th extractions at 100�C (blue), 125�C (red), 150�C (yellow) and 200�C (green). (C) Cumulative values of the absorbance at 660 nm in the 1st, 2nd, 3rd and 4th extractions are shown for each temperature. (D) HPLC chromatogram of the 1st extraction at 100, 125, 150 or 200�C. The peaks of the putative degraded PCB are indicated with asterisks. (E) HPLC chromatogram of the 1st, 2nd and 3rd extractions at 125�C. (F) Absorption spectra for peak 1 and peak 2 in the chromatogram for the 1st extraction at 125�C. (G) MS spectra for peak 1 (upper) and peak 2 (lower) in the chromatogram for the 1st extraction at 125�C.

