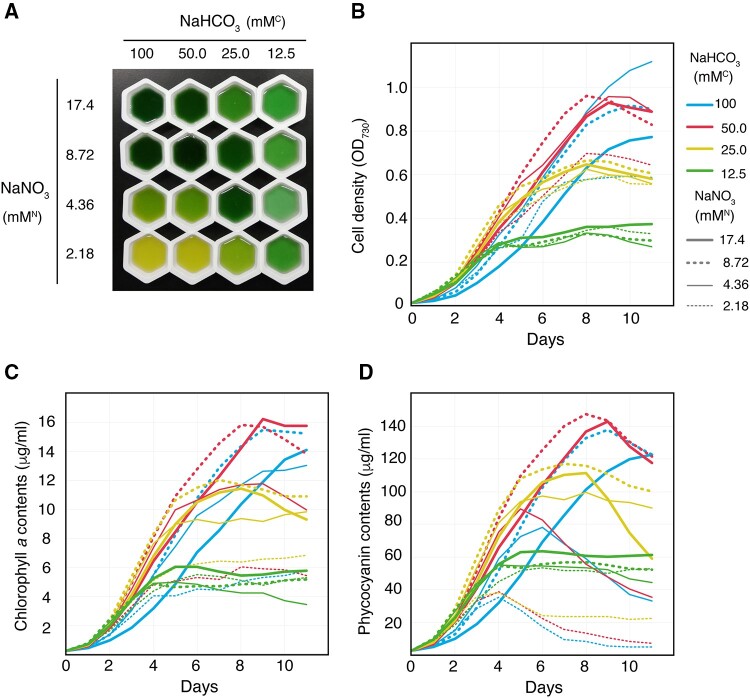
Fig. 3.
Effects of carbon and nitrogen concentrations on the growth and pigmentation of Synechocystis. (A) Photograph of Synechocystis cell cultures harvested on day 11. Concentrations of NaHCO3 and NaNO3 are shown. Cell density (B), chlorophyll a (C) and phycocyanin (D) content, as estimated by absorption spectroscopy. The OD730 value in (B) was measured with an integrating sphere and gave lower values of OD730 compared with those measured with a conventional UV–Vis spectrometer. (B–D) The different concentrations of NaHCO3 and NaNO3 are shown as colored lines according to the legend.

