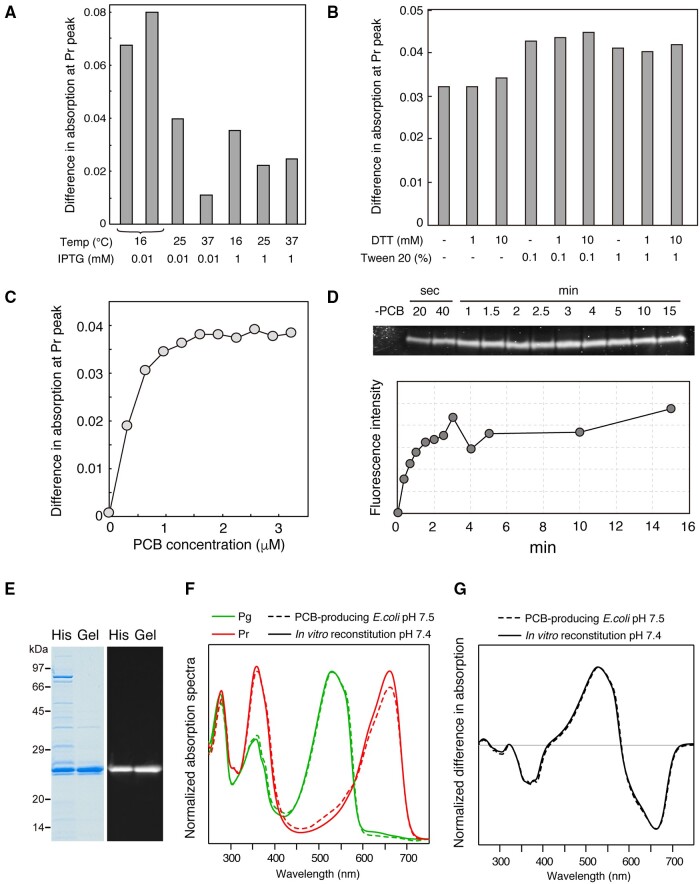
Fig. 5.
In vitro reconstitution of the extracted PCB with the apoprotein of RcaE. (A and B) The amount of the holoprotein of RcaE in the E. coli lysate was estimated by the difference in the absorption maximum of Pr peak (A660) after illumination with green or red light. The RcaE apoprotein was expressed at different temperatures and IPTG concentrations (A) or in the presence of different DTT and Tween 20 concentrations (B) as shown. (C) Plots for the difference in the absorption maximum of the Pr peak for different amounts of PCB. (D) Time course of the formation of a covalent linkage of PCB was monitored as the fluorescence of PCB in the acrylamide gel after SDS-PAGE (upper). The intensity of each band was quantified and plotted (lower). (E) Protein purity of the holoproteins after Ni-affinity chromatography (His) and subsequent gel-filtration chromatography (Gel) are shown with CBB staining (left) and fluorescence (right) of the acrylamide gel after SDS-PAGE. (F) Absorption spectra of the Pg (green line) and Pr (red line) of the RcaE holoprotein prepared from the in vitro reconstitution (solid line) and PCB-producing E. coli (dashed line). (G) Different absorption spectra of Pg minus Pr prepared from the in vitro reconstitution (solid line) and PCB-producing E. coli (dashed line). Spectra were normalized at the Pg peak. Different pH values of the HEPES buffer in the preparation of the holoproteins are shown.

