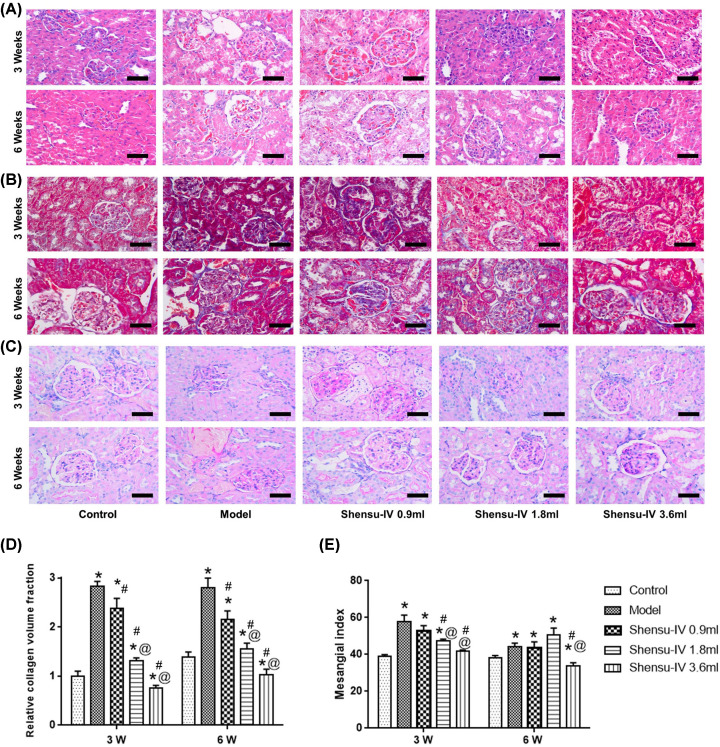
Figure 2. Pathological changes in kidney tissues.
(A) Hematoxylin and Eosin (H&E), (B) Masson’s, and (C) PAS staining were used to observe the pathological changes in renal tissues in each group. Magnification: ×200. (D) The relative collagen volume fraction. (E) The mesangial index. Compared with the control group, *P<0.05; compared with the model group, #P<0.05; compared with the Shensu-IV 0.9 ml group, @P<0.05.

