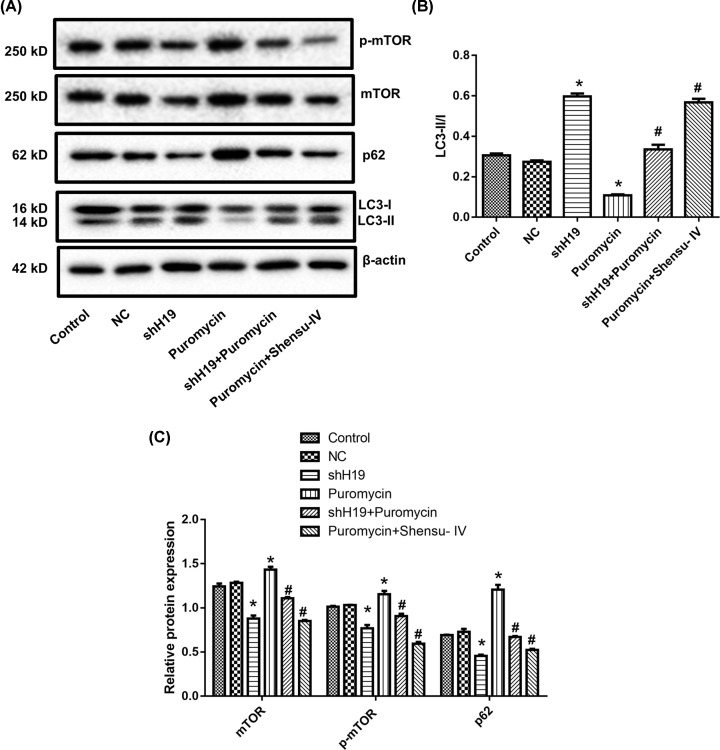
Figure 9. Treatment with shH19 or Shensu IV promoted autophagy in puromycin-induced injury in podocytes.
(A) Representative blots of mTOR, p62, and LC3. Original blots are shown in Supplementary Figure S1. (B) Quantification of the LC3-II/I ratio. (C) Quantification of the levels of mTOR, p-mTOR, and p62. Compared with the negative control (NC) group, *P<0.05; compared with the puromycin group, #P<0.05.

