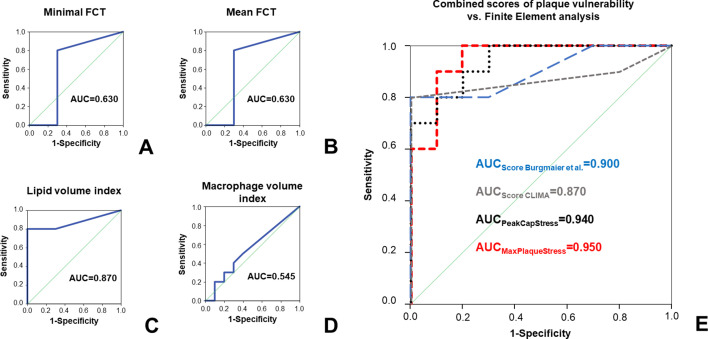
Figure 4. Comparison of stress concentration to ‘classical’ features of plaque vulnerability in prediction of plaque rupture.
ROC curves for the prediction of plaque rupture for minimal FCT (A), mean FCT (B), lipid volume index (C), and macrophage volume index (D). In (E), ROC curves for two established OCT scores combining different features of plaque vulnerability are depicted (respectively: scores calculated according to Burgmaier et al., 2014 in blue and according to the CLIMA study (Prati et al., 2020 in grey) and compared to the ROC curves for peak cap stress (PCS, black dotted line) or maximal plaque stress (MPS, red dashed line).

