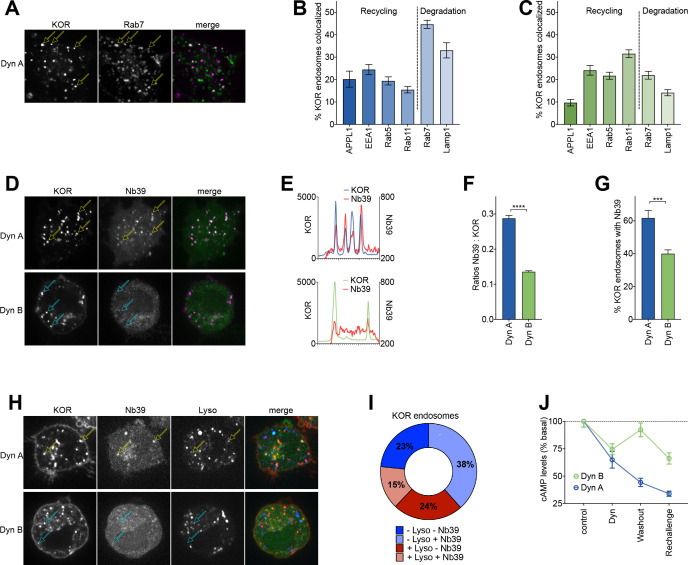
Figure 3. Dyn A selectively drives KOR signaling from late endosomal compartments.
(A) Representative image of a PC12 cell expressing FLAG-KOR and Rab7-GFP, treated with 1 µM Dyn A for 20 min. Yellow arrows denote KOR endosomes that colocalize with Rab7. (B) SpH-KOR cells treated with 1 μM Dyn A for 20 min were fixed and processed for immunofluorescence with the noted markers. Quantitation, across multiple cells, of the percentage of KOR containing endosomes that colocalize with each of the endosomal markers is noted. KOR primarily localizes in Rab7 and Lamp1 positive late endosomes after Dyn A (n = 8, 10, 9, 11, 20, and 17 cells for APPL1, EEA1, Rab5, Rab11, Rab7, and Lamp1, respectively). (C) A similar quantitation of immunofluorescence images after Dyn B treatment (1 μM for 20 min) shows that KOR localizes less with late endosomes, and more with markers of early/recycling endosomes (n = 18, 16, 15, 18, 23, and 29 cells for APPL1, EEA1, Rab5, Rab11, Rab7, and Lamp1, respectively). (D) Representative images of PC12 cells expressing FLAG-KOR and Nb39, imaged live after treatment with 1 µM Dyn A or Dyn B for 20 min. Yellow arrows in Dyn A show KOR endosomes that recruited Nb39, while cyan arrows in Dyn B show KOR endosomes that do not show obvious recruitment of Nb39. (E) Linear profile plots of fluorescence of KOR and Nb39, measured along lines drawn across regions of the cell with KOR endosomes after treatment with 1 μM Dyn A or Dyn B for 20 min, show that Nb39 fluorescence increases along with KOR in Dyn A, but less noticeably with Dyn B. (F) Ratios of integrated fluorescence of Nb39:KOR in endosomes identified by 3D object analysis show higher amounts of Nb39 relative to KOR in Dyn A-treated cells (****p<0.0001 by Mann–Whitney, n = 766 and 800 endosomes for Dyn A and Dyn B, respectively). (G) Quantitation of the percentage of KOR endosomes per cell with a noticeable increase in Nb39 fluorescence above background shows a higher fraction of KOR endosomes recruited Nb39 in 1 µM Dyn A-treated cells (***p<0.001 by Mann–Whitney, n = 11 and 14 cells for Dyn A and Dyn B, respectively). (H) Representative images of PC12 cells expressing FLAG-KOR and Nb39 and labeled with LysoTracker imaged live after treatment with 1 μM Dyn A or Dyn B for 20 min. Yellow arrows in Dyn A show KOR endosomes that recruited Nb39 that were also labeled with Lysotracker, while cyan arrows in Dyn B show KOR endosomes that do not show obvious labeling with Nb39 and Lysotracker. (I) The average composition of total KOR endosomes that are positive for ±Nb39 and ±Lysotracker after 20 min treatment with Dyn A (1 μM). n = 10 cells. −Lyso/−Nb39 = 23.4 ± 8.1%; −Lyso/+Nb39 = 38.4% ± 17.4%; +Lyso/−Nb39 = 23.7 ± 11.4%; +Lyso/+Nb39 = 14.6 ± 5.1%. (J) cAMP levels after initial Dynorphin treatment (1 μM) for 5 min, washout for 25 min, or a Dynorphin rechallenge (1 μM) at end of the washout, show comparable initial cAMP inhibition by both Dyn A and Dyn B, but persistent signaling by Dyn A after agonist washout.


