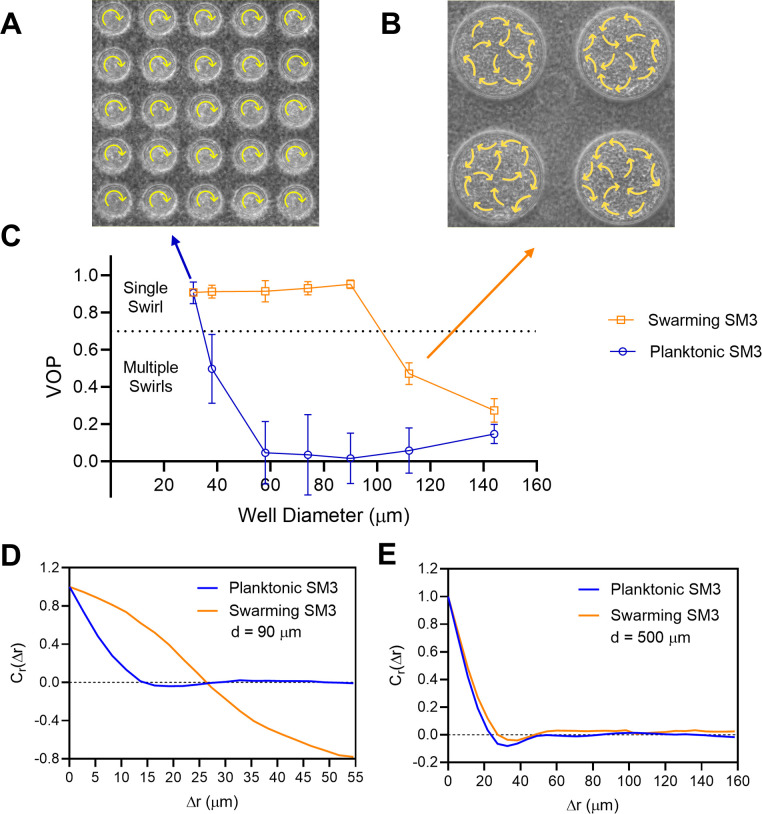
Figure 2. The effect of well diameter on confined Enterobacter sp SM3 motility patterns.
(A and B) Motion pattern of concentrated planktonic SM3 confined in 31 μm (A) and swarming SM3 confined in 112 μm (B) diameter microwells. (C) VOP of swarming and concentrated planktonic SM3 as a function of well diameter. The error bars represent standard deviations (± SD), and the sample size is n = 5. (D and E) Spatial autocorrelations of the bacterial velocity field in the well diameters of 90 μm (D) and 500 μm (E). The depth of the wells was 22 μm for all well diameters shown in this figure.

