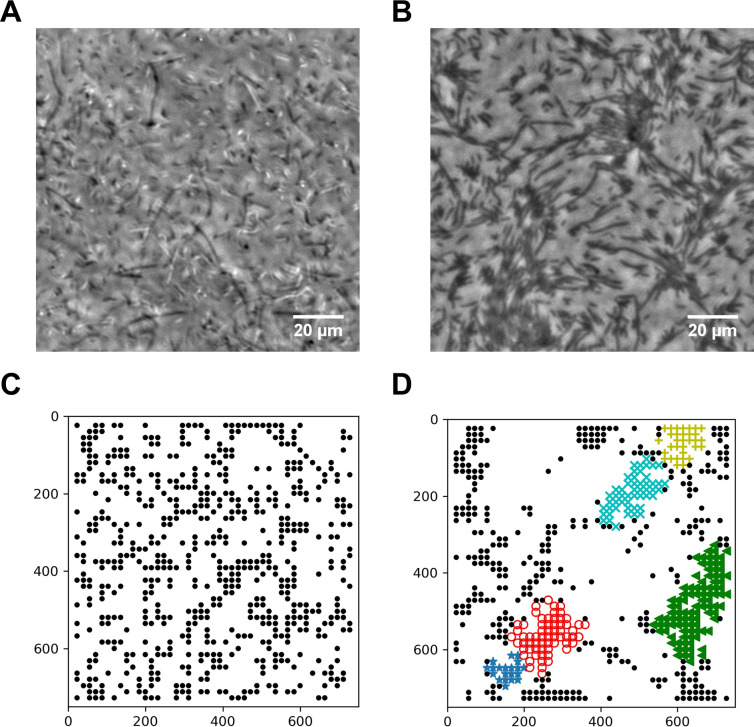
Figure 4. Spatial distribution of swarming and swimming SM3 cells.
(A and B) Snapshots showing diluted swarming SM3 (A) and planktonic SM3 (B) on a soft agar surface, respectively. (C and D) DBSCAN clustering analysis of diluted swarming SM3 (C) and planktonic SM3 (D). Black dots represent moving bacterial cells and colored markers show cells in clusters, as determined by the program. The numbers on the axes correspond to pixels on the images.

