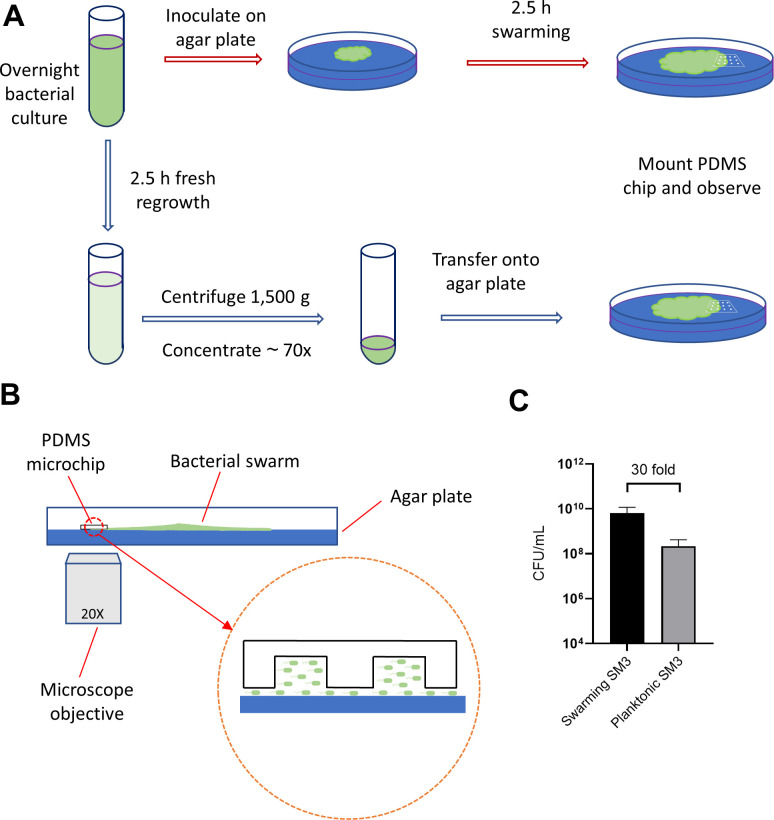
Figure 7. Illustration of experimental procedure.
(A) Schematic of sample preparation procedure. Red arrows represent the assay procedure for swarming bacteria. Blue arrows represent the assay procedure for swimming planktonic bacteria. (B) Schematic diagram of the experimental device (side view). The gap of a few microns between the PDMS chip and the agar surface, illustrated in magnified view, allows the bacteria under the chip to spread. (C) Cell density measured by colony forming unit (CFU/mL) of swarming SM3 and swimming, planktonic SM3. Swarming SM3 cell density is measured after SM3 swarming on an agar surface for 2.5 hr while swimming SM3 cell density is measured for overnight SM3 culture being regrown in fresh Lysogeny Broth (LB) for 2.5 hr. Since cell density of swarming SM3 was higher than that of planktonic SM3, the latter was concentrated to acquire comparable cell density before being applied on the agar plate.

