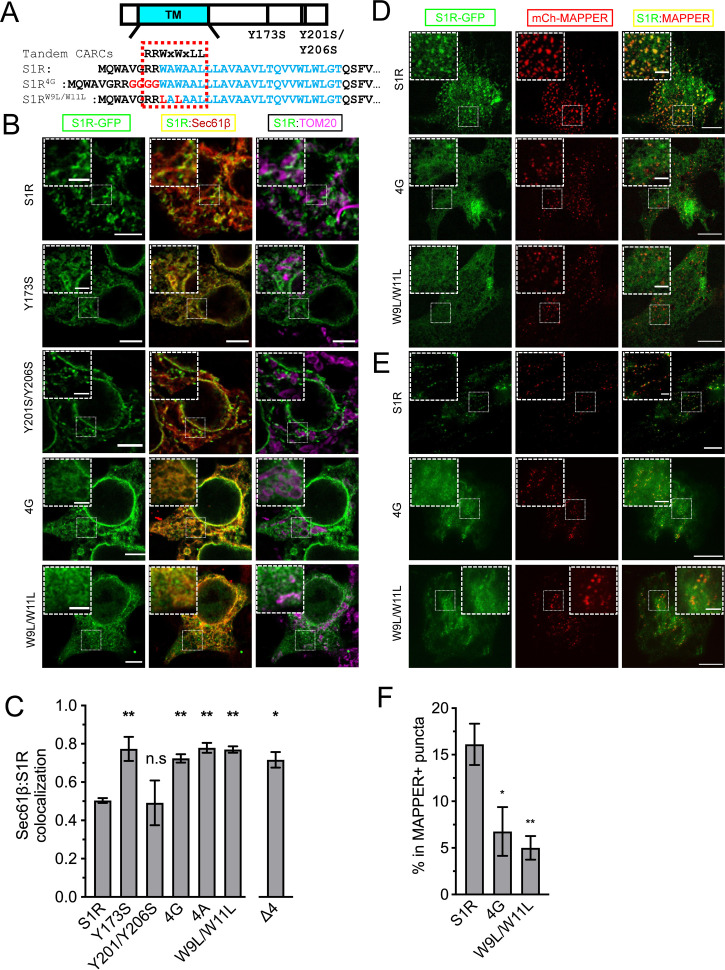
Figure 3. Cholesterol-binding motifs in the S1R sequence.
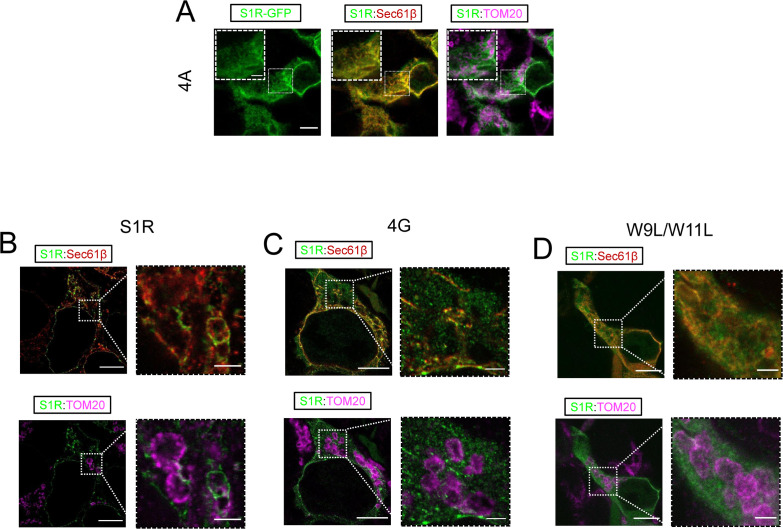
(A) A schematic representation of the S1R primary sequence with its transmembrane helix (TM) in cyan. Previously proposed cholesterol-binding residues (Y173, Y201/Y206) (Palmer et al., 2007) are marked. Sequence analysis identified tandem CARC binding motifs (indicated by a dashed red line) in the TM region (marked in cyan font). Mutations were introduced either by insertion of the four-glycine repeat (4G) or by mutation of the two critical tryptophan residues to leucines (W9L/W11L). (B) Intracellular distribution of the WT receptor and cholesterol-binding mutants in HEK293 cells, S1R-GFP in green, mCherry-Sec61β in red, and anti-TOM20 in magenta. Scale bars = 5 μm, insets = 2.5 μm. (C) Quantification of the Mander’s colocalization coefficient between the mCherry-Sec61β and S1R-GFP for WT receptor and mutant forms. Data is mean ± SEM from n = 3 independent experiments (n = 2 for Y173S, Y201S/Y206S, 4A). p-values (n.s. p>0.05, *p<0.05, **p<0.01): Y173S vs. WT: p=0.007, Y201S/Y206S vs. WT: p>0.999, 4G vs. WT: p=0.014, 4A vs. WT: p=0.006, W9L/W11L vs. WT: p=0.003, Δ4 vs. WT: p=0.017, based on ANOVA test with Dunnett’s post hoc test. (D) Distribution of the WT S1R-GFP, S1R-4G, and S1R-W9L/W11L mutants (in green) in HEK293 cells in the confocal plane near the plasma membrane (PM). Endoplasmic reticulum (ER)-PM junctions were visualized with a genetically encoded marker MAPPER (in red). Scale bars = 5 μm, insets = 1.5 μm. (E) Distribution of the WT S1R-GFP, S1R-4G, and S1R-W9L/W11L mutants (in green) in HEK293 cells visualized using total internal reflection fluorescence microscopy, with ER-PM junctions labeled with MAPPER (in red). Scale bars = 5 μm, insets = 1.5 μm. (F) Fraction of S1R residing in the MAPPER-positive puncta, calculated from data shown in (E). p-values (*p<0.05, **p<0.01): 4G vs. WT: p=0.025, W9L/W11L vs. WT: p=0.008, based on ANOVA test with Dunnett’s post hoc test.


