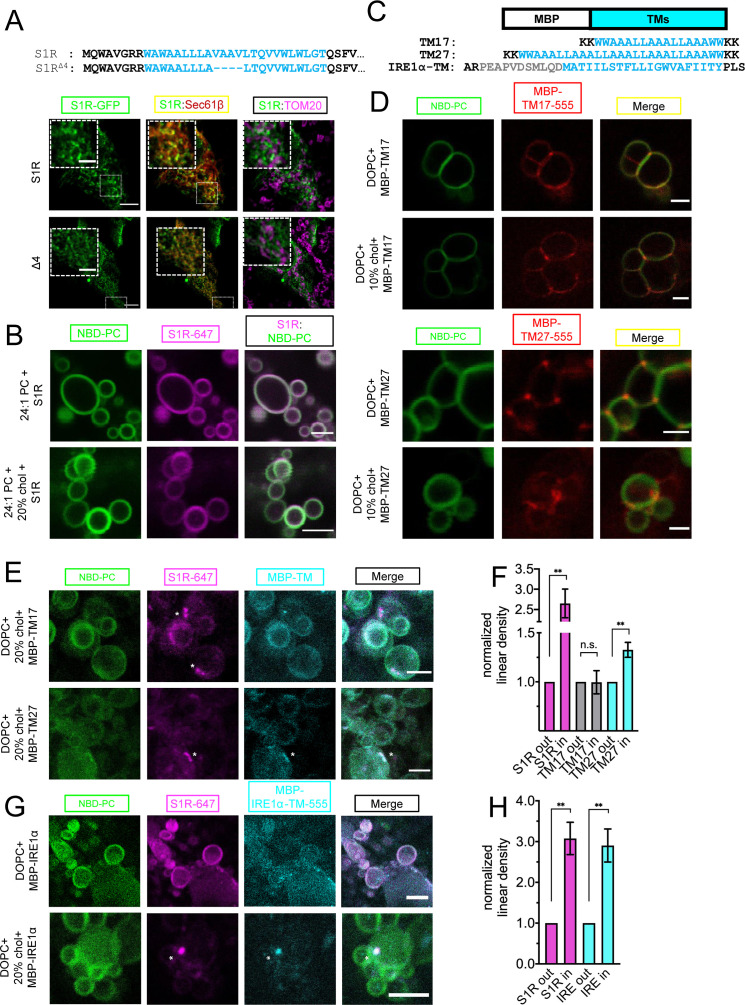
Figure 5. Importance of membrane bilayer thickness for S1R cluster formation.
(A) Deletion of the four amino acid stretch from the S1R transmembrane (TM) domain (top) and intracellular localization of full-length (WT) and shortened mutant (S1R-Δ4) in HEK293 cells. S1R-GFP in green, mCherry-Sec61β in red, and anti-TOM20 in magenta. Scale bars = 10 μm, insets = 2.5 μm. Mander’s colocalization coefficient for the Δ4 mutant in plotted on Figure 3C. (B) Distribution of S1R-647 (magenta) in 24:1 phosphatidylcholine (PC) giant unilamellar vesicles (GUVs) (NBD-PC in green) in the absence (top) or presence of 20 mol % cholesterol (bottom). Scale bars = 10 μm. (C) Construct design and primary amino acid sequences of MBP-TM17, -TM27, and -IRE1α-TM proteins. Synthetic TM domain in shown in cyan. Construct design of MBT-TMs was based on Kaiser et al., 2011. TM helix of IRE1α is shown in cyan and the adjacent amphipathic helix is in gray. Construct design of MBP-IRE1α-TM was based on Cho et al., 2019. (D) Distribution of purified MBP-TM17-555 (top six panels) and MBP-TM27-555 (lower six panels) in DOPC GUVs in the absence or presence of 10 mol % cholesterol.MBP-TMs are shown in red and NBD-PC in green. Scale bars = 5 μm (MBP-TM17 panels) and 2.5 μm (MBP-TM27 panels). (E) Distribution of S1R-647 (magenta) co-reconstituted together with MBP-TM17-555 (cyan, top panel) or MBP-TM27-555 (bottom panel) in DOPC GUVs in the presence of cholesterol (NBD-PC in green). S1R clusters are labeled with asterisks. Scale bars = 5 μm (MBP-TM17) and 2.5 μm (MBP-TM27). (F) Linear density of S1R-647 (magenta), MBP-TM17-555 (gray), and MBP-TM27-555 (cyan) outside and inside S1R clusters. Data is mean ± SEM. p-values (n.s. p>0.05, ** p-value<0.01): S1R in vs. S1R out (n = 9): p-value=0.002, TM17 in vs. TM17 out (n = 5): p-value=0.975, TM27 in vs. TM27 out (n = 8): p-value=0.004 based on two-tailed t-test. (G) Distribution of S1R-647 (magenta) co-reconstituted together with MBP-IRE1α-TM-555 (cyan) in GUV (NBD-PC in green) in the absence (top) and presence (bottom) of 20 mol % cholesterol. S1R cluster is labeled with an asterisk. Scale bars = 10 μm (top panels) and 5 μm (bottom panels). (H) Linear density of S1R-647 (magenta) and MBP-IRE1α-TM-555 (cyan) outside and inside S1R clusters. Data is mean ± SEM. p-values: S1R in vs. S1R out (n = 6): **p-value=0.003, IRE1α in vs. IRE1α out (n = 6): ** p-value=0.005 based on two-tailed t-test.


