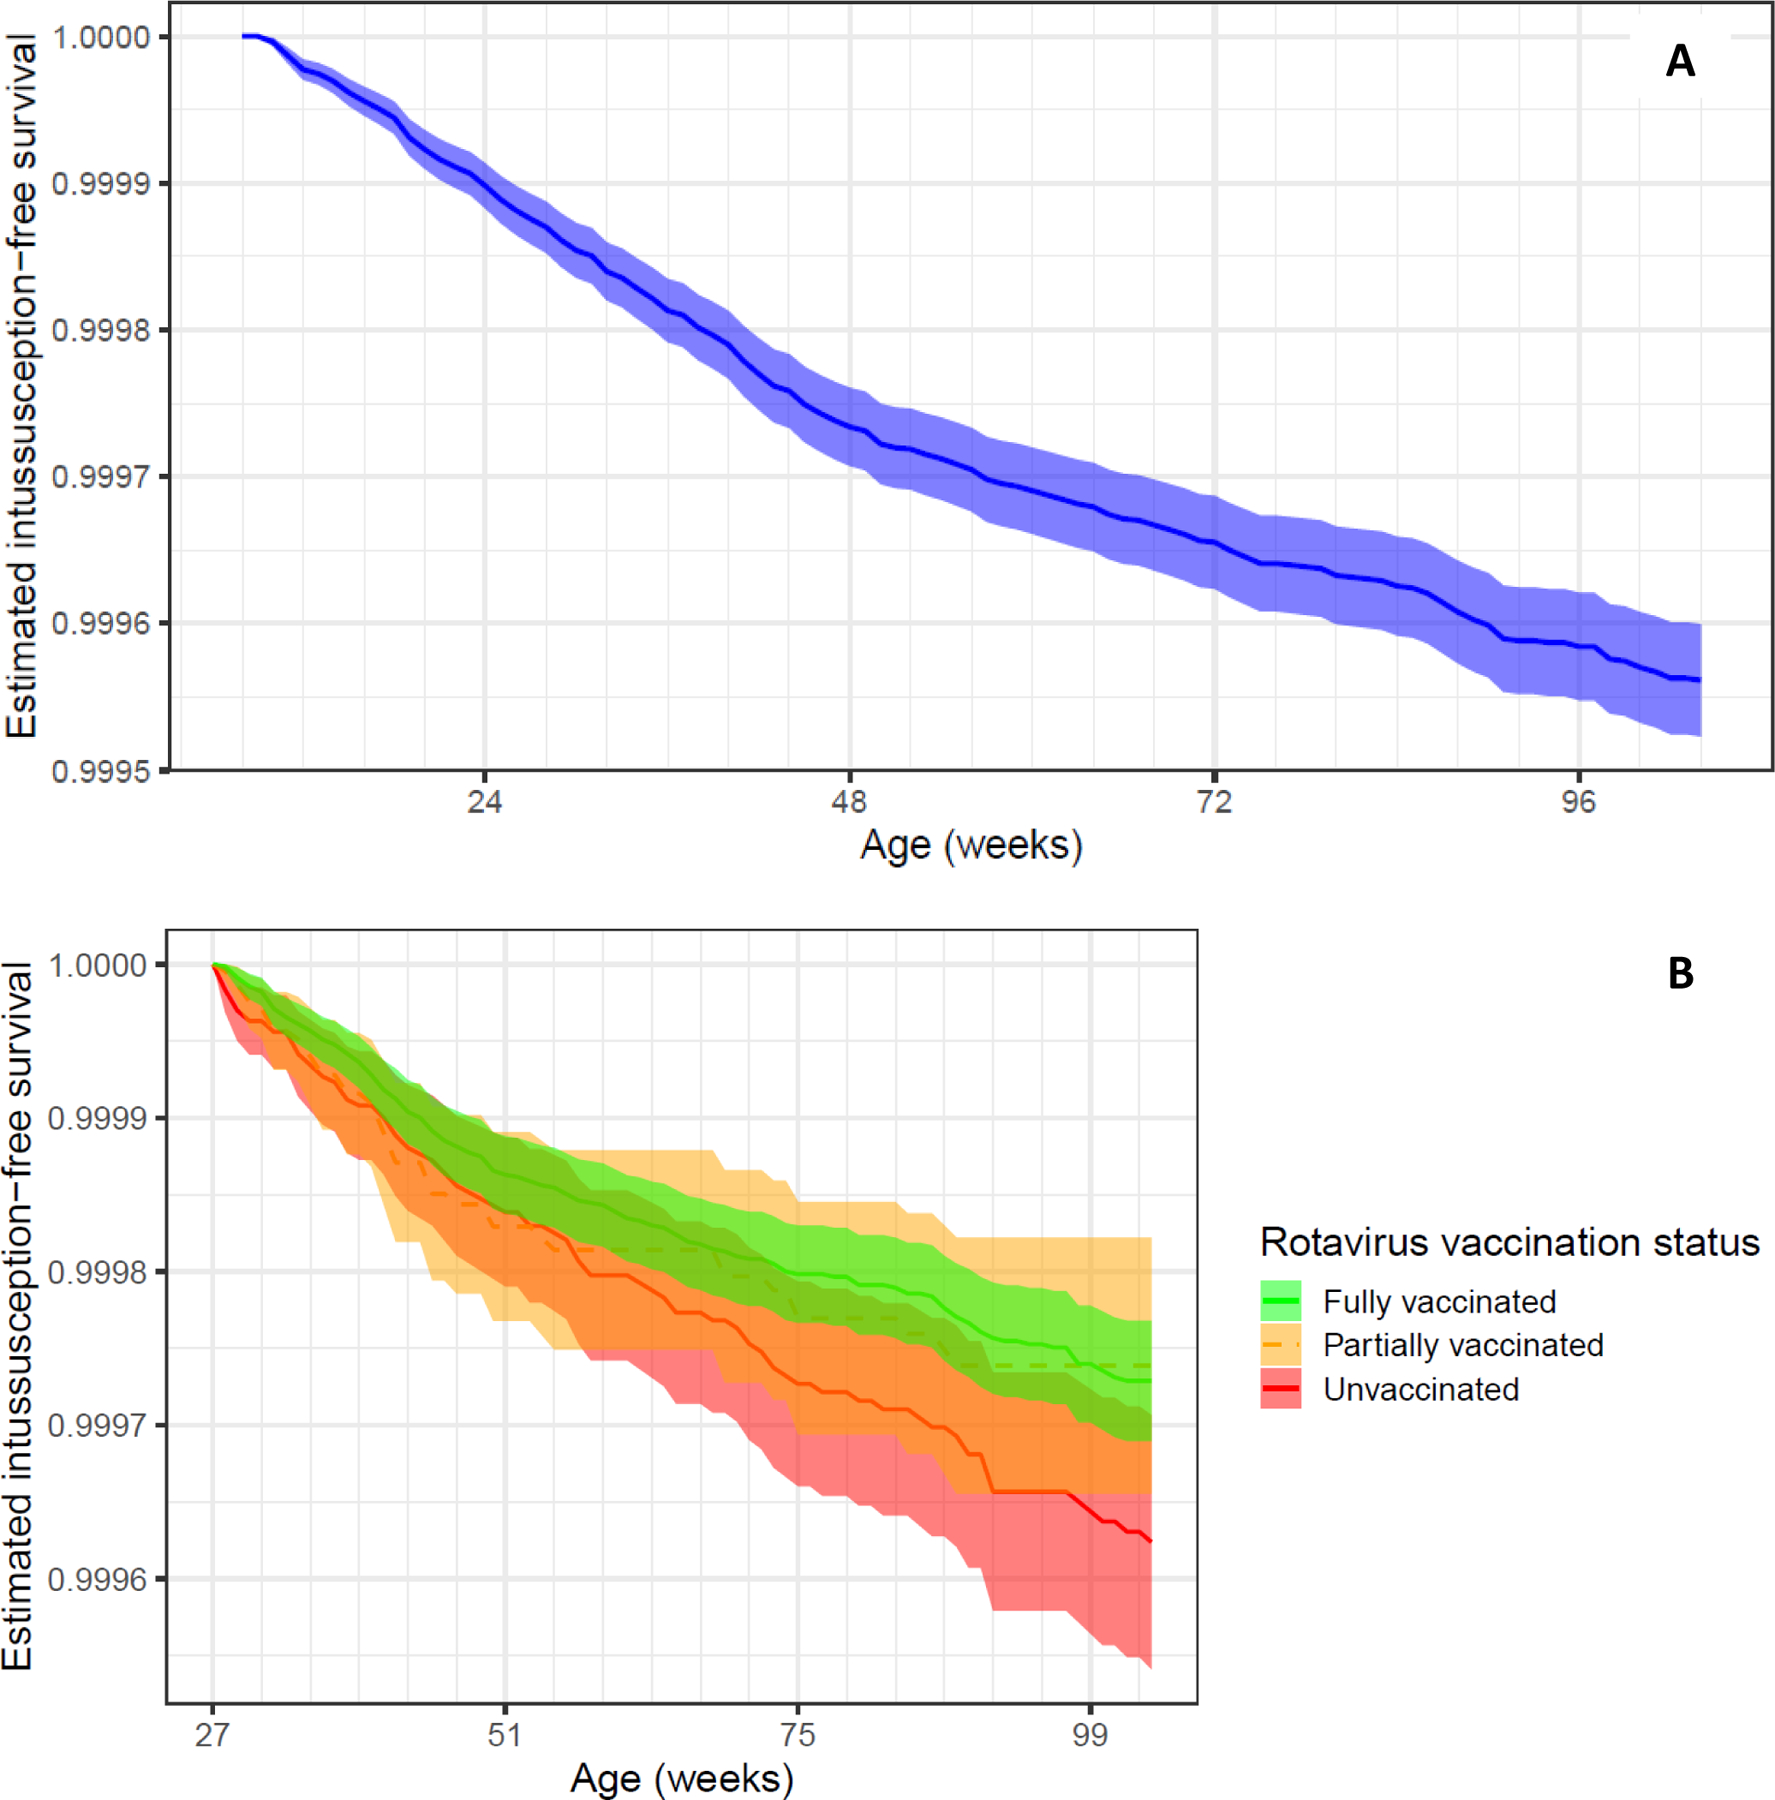
Figure 1: Unadjusted intussusception hospitalization survival curves.

A) Crude survival curve. The plot is shown beginning at 8 weeks and going to 2 years of age. Only children with at least 8 weeks of continuous enrollment were included (N = 1,858,827). B) Crude survival curve, by vaccination status. Intussusception survival curves overlapped among children fully vaccinated (green), as compared to children partially (yellow) or unvaccinated (red) against rotavirus. The plot is shown beginning at 27 weeks (N = 1,463,313), by which time all children are eligible to be fully vaccinated against rotavirus. Rotavirus vaccination status is treated as time-varying.
