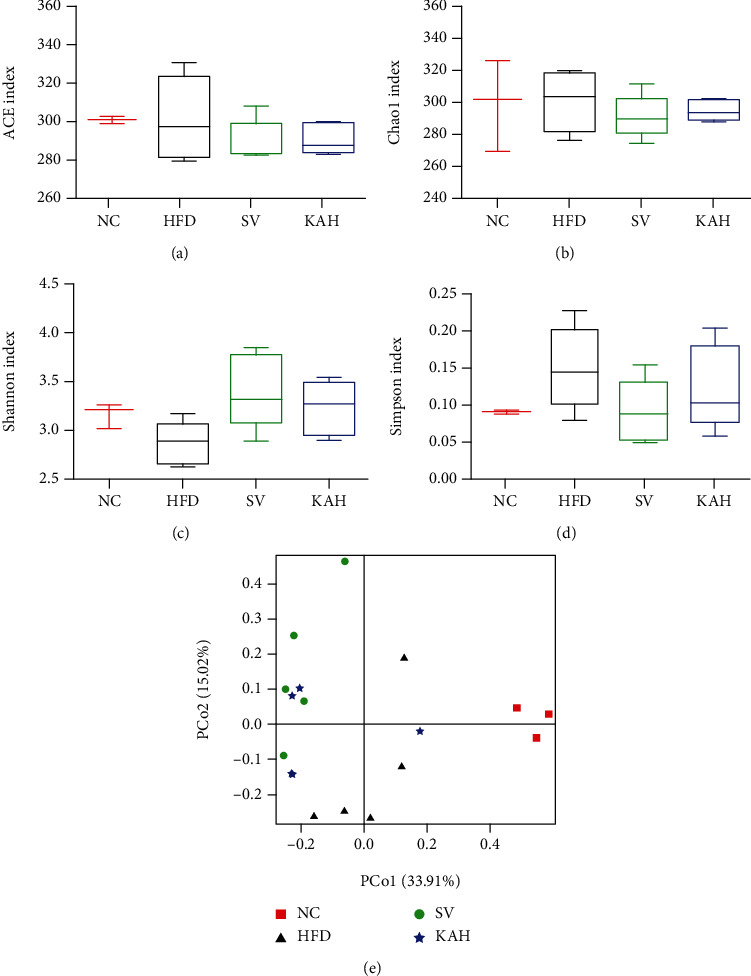
Figure 5.

Alpha diversity analysis and beta diversity analysis for gut microbiota: (a) ACE index; (b) Chao1 index; (c) Shannon index; (d) Simpson index; (e) the principal coordinates analysis (PCoA) chart. In alpha diversity analysis, no significant differences at P > 0.05 (a–d) were observed between NC group and HFD, SV, or KAH groups, respectively. In beta diversity analysis, neither SV nor KAH obviously reversed the changes induced by HFD (e). Data were represented as mean ± SD for (a–d) (n = 3 for NC group, n = 5 for other groups).
