Figure 3.

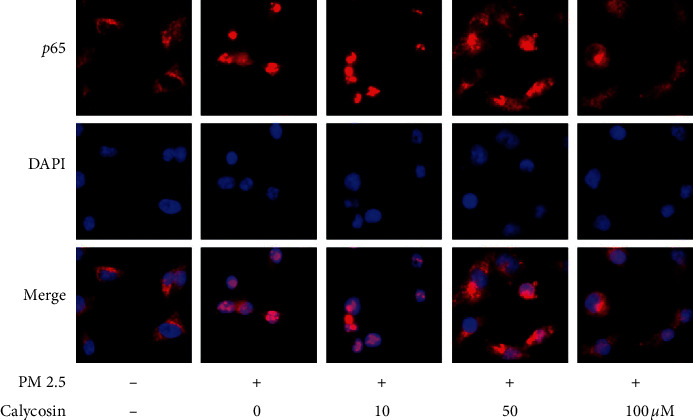
Immunofluorescence analysis of the NF-κB p65 distribution in B2B cells of different groups (40 × magnification; red = NF-κB p65; blue = DAPI staining of nuclei).

Immunofluorescence analysis of the NF-κB p65 distribution in B2B cells of different groups (40 × magnification; red = NF-κB p65; blue = DAPI staining of nuclei).