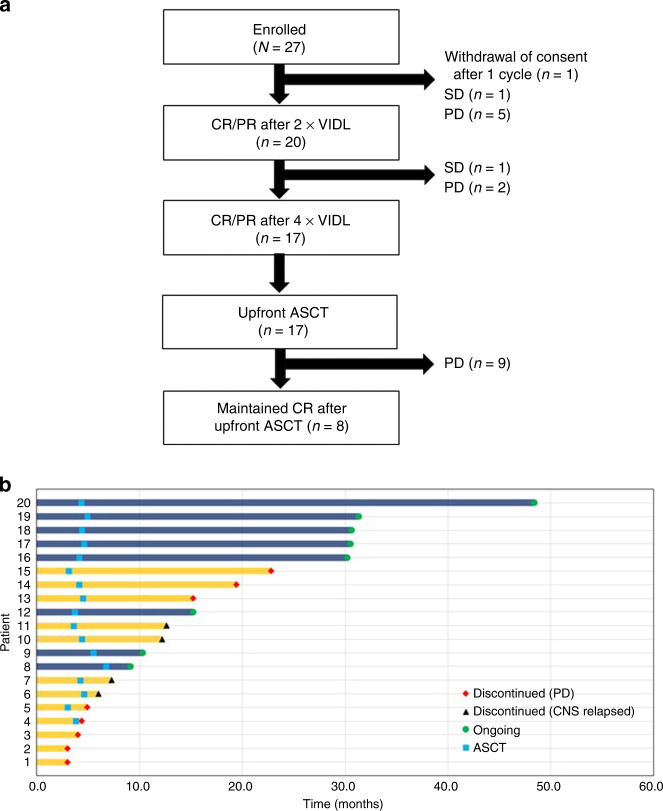
Fig. 1. Flowing chart of the study cohort showing the numbers and types of treatment failures and responding patients throughout the different stages of the protocoled treatment algorithm.
VIDL etoposide, ifosfamide, dexamethasone, L-asparginase; CR complete remission, PR partial remission, SD stable disease; PD progressive disease, ASCT autologous stem cell transplantation (A) and duration of response (DOR) of the patients who achieved complete or partial response (B).

