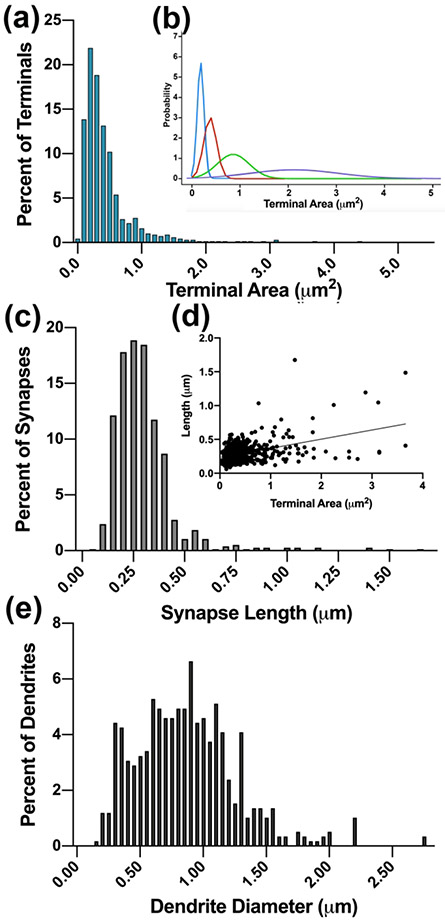
Figure 4.
(a). The frequency distribution histogram of terminal cross-section areas reveals multimodal population. (b). Four subpopulations revealed by a BIC analysis (R-MClust) are fitted as curves and plotted in different colors. (c). The frequency distribution histogram of synapse lengths. (d). A pairwise plot of terminal cross-section areas and the length of the synapses formed by each terminal (•), and the best fit linear correlation line. (e) The frequency distribution histogram of the calibers of dendrites that are postsynaptic to terminals in the dataset.

