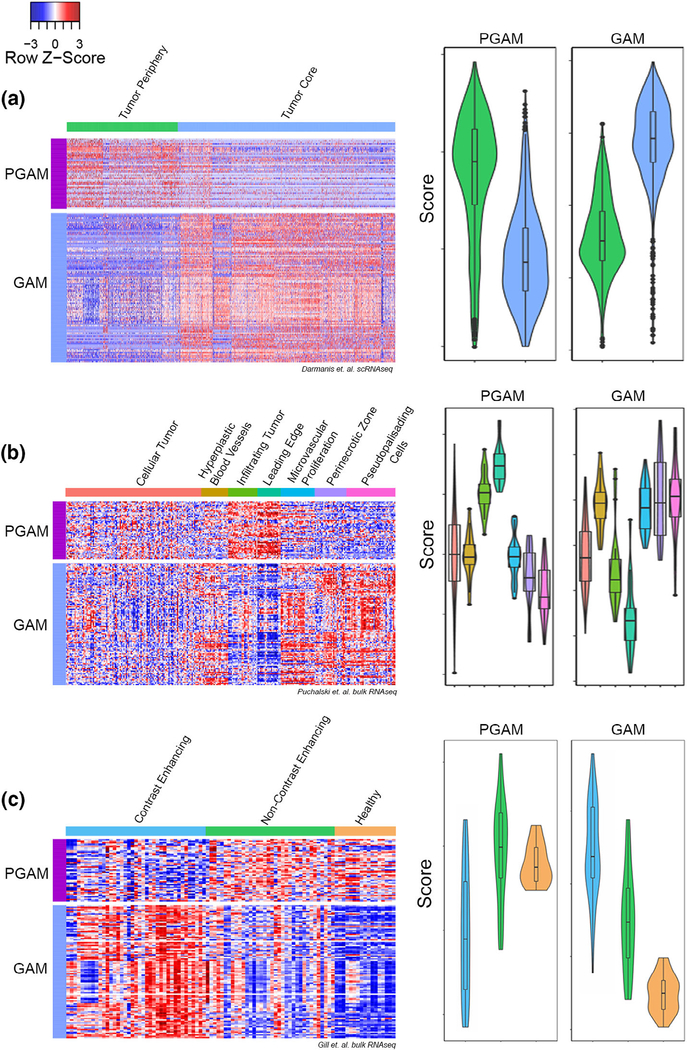
FIGURE 3.
A novel peritumoral glioma-associated microglia (PGAM) gene signature. (a–c) Left, heatmap of relative expression levels of PGAM and tumor core glioma-associated microglia/macrophages (GAM) genes, grouped horizontally by anatomical sample location. Rows are scaled by z score. Right, violin plots of signature scores generated by averaging PGAM or GAM gene expression across samples. Dataset derived from (a) Darmanis et al.; (b) Puchalski et al. (IVY GAP); and (c) Gill et al. Y-axes represent scores specific to each dataset, and are not on the same scale between gene signatures, or across datasets

