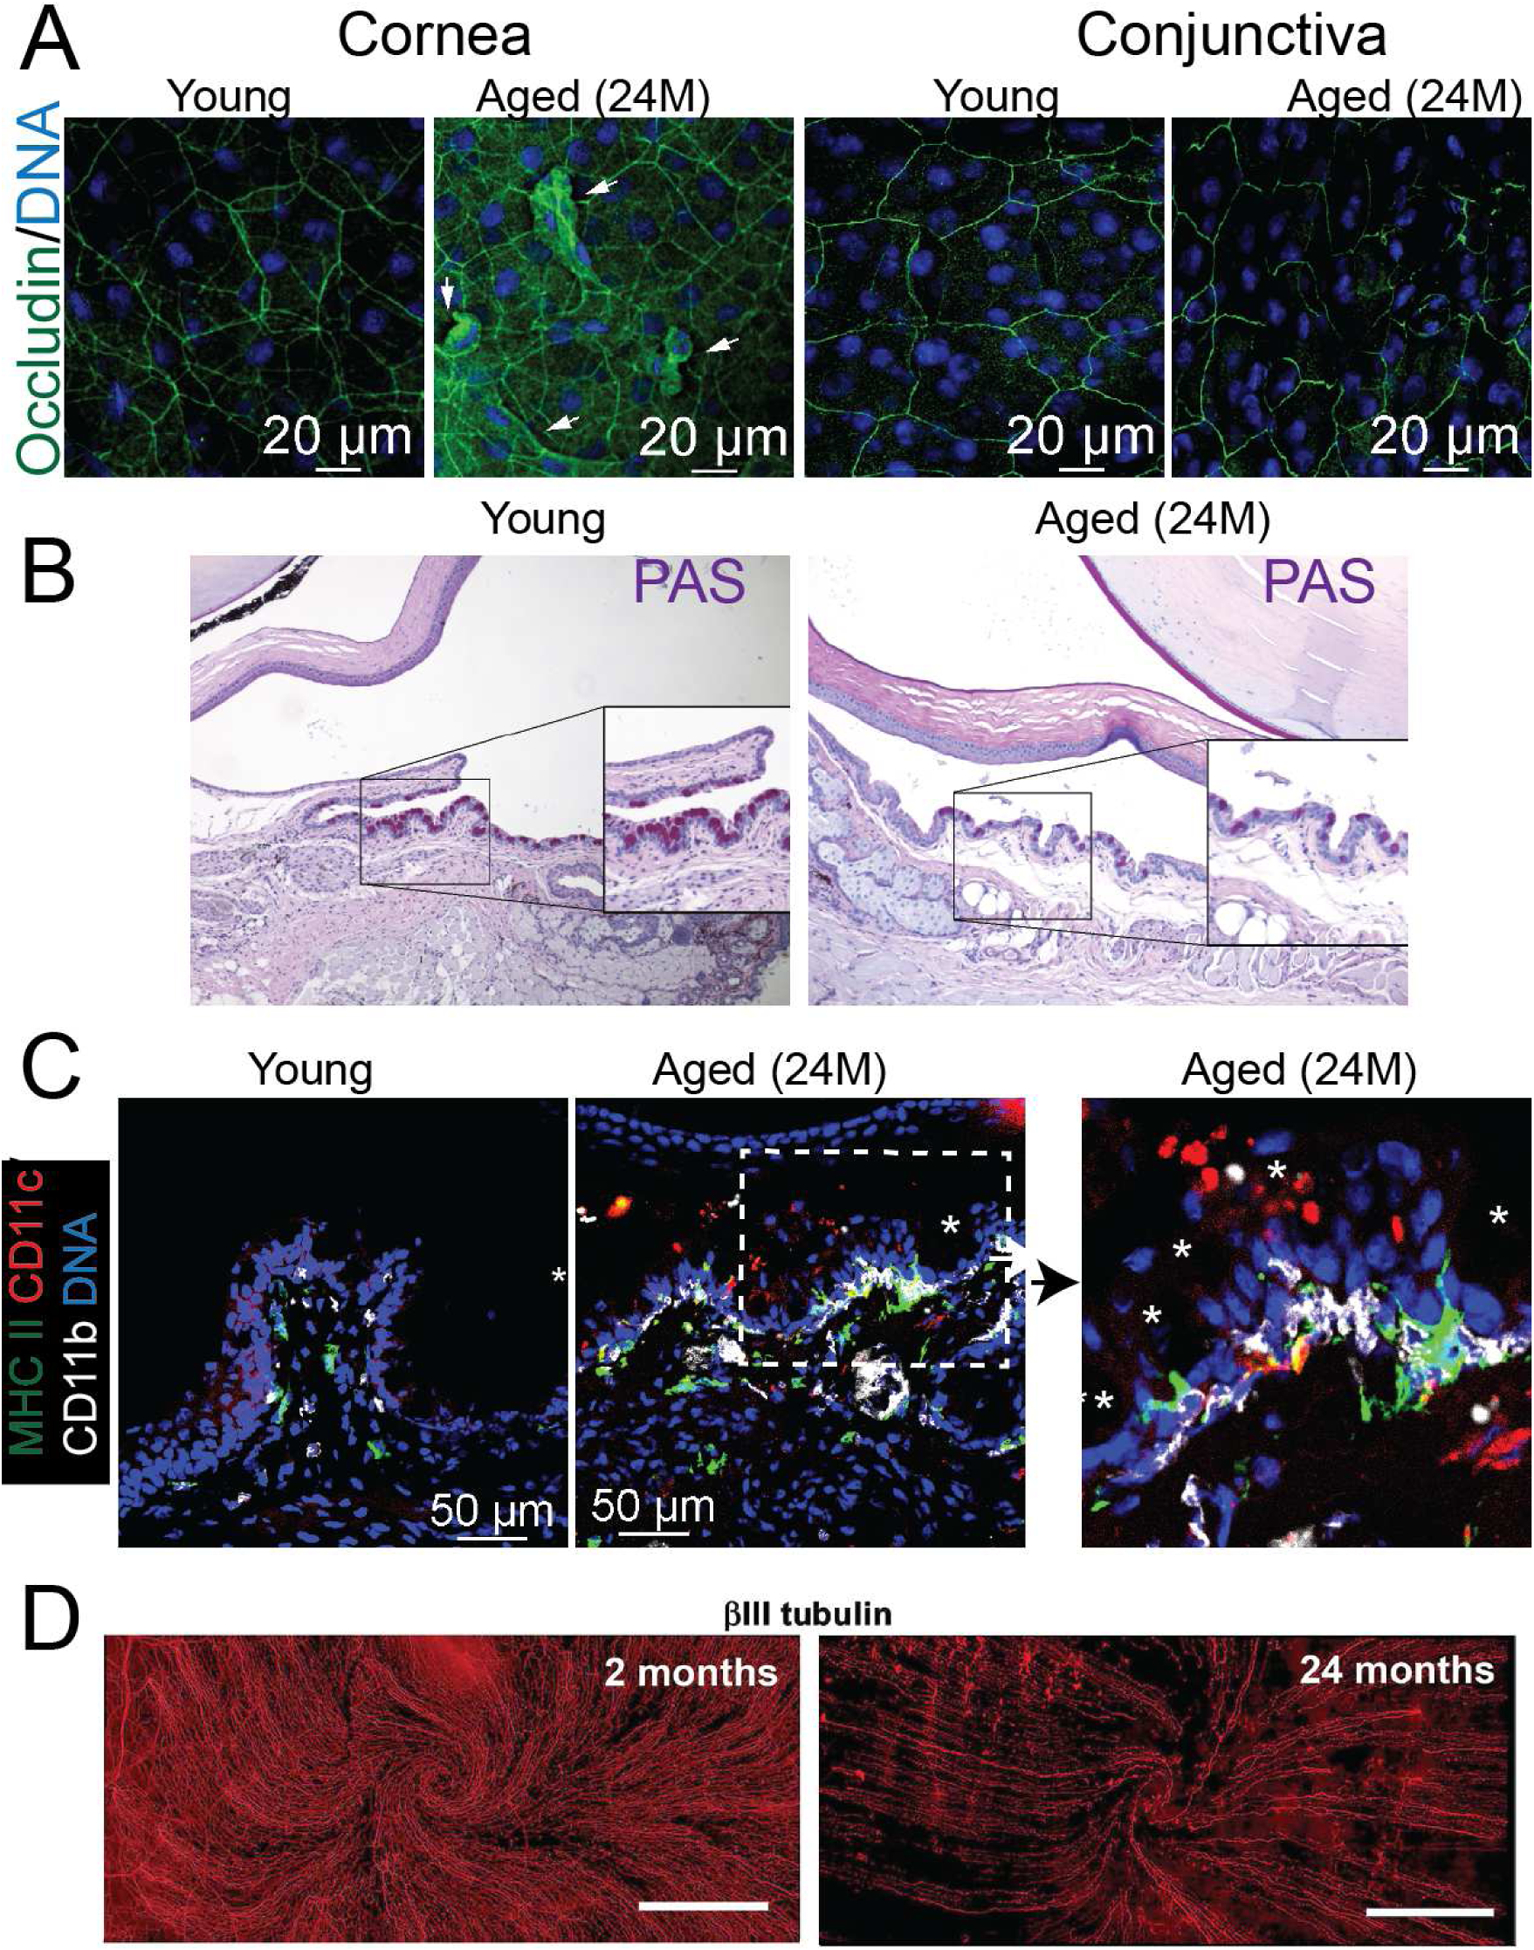
Figure 3: Ocular surface changes during aging.

A. Representative laser scanning confocal microscope images of whole mounts of cornea and conjunctiva stained with occludin (green) and Hoechst 33342 DNA staining (blue). Arrows indicate desquamating cells. B. Representative bright-field images of conjunctiva sections showing PAS+ cells (purple-magenta). Insets are high magnification of a demarcated area. C. Representative laser scanning confocal microscope images of conjunctiva cryosections stained with MHC II (green), CD11c (red) and CD11b (white), and Hoechst 33342 nuclear staining (blue). Asterisks indicate goblet cells; the dotted area is magnified on the right. D. Representative whole-mount images of corneas stained with β-III tubulin antibody ([421], published under a Creative Commons CC BY 4.0 license). 24M = 24 months
