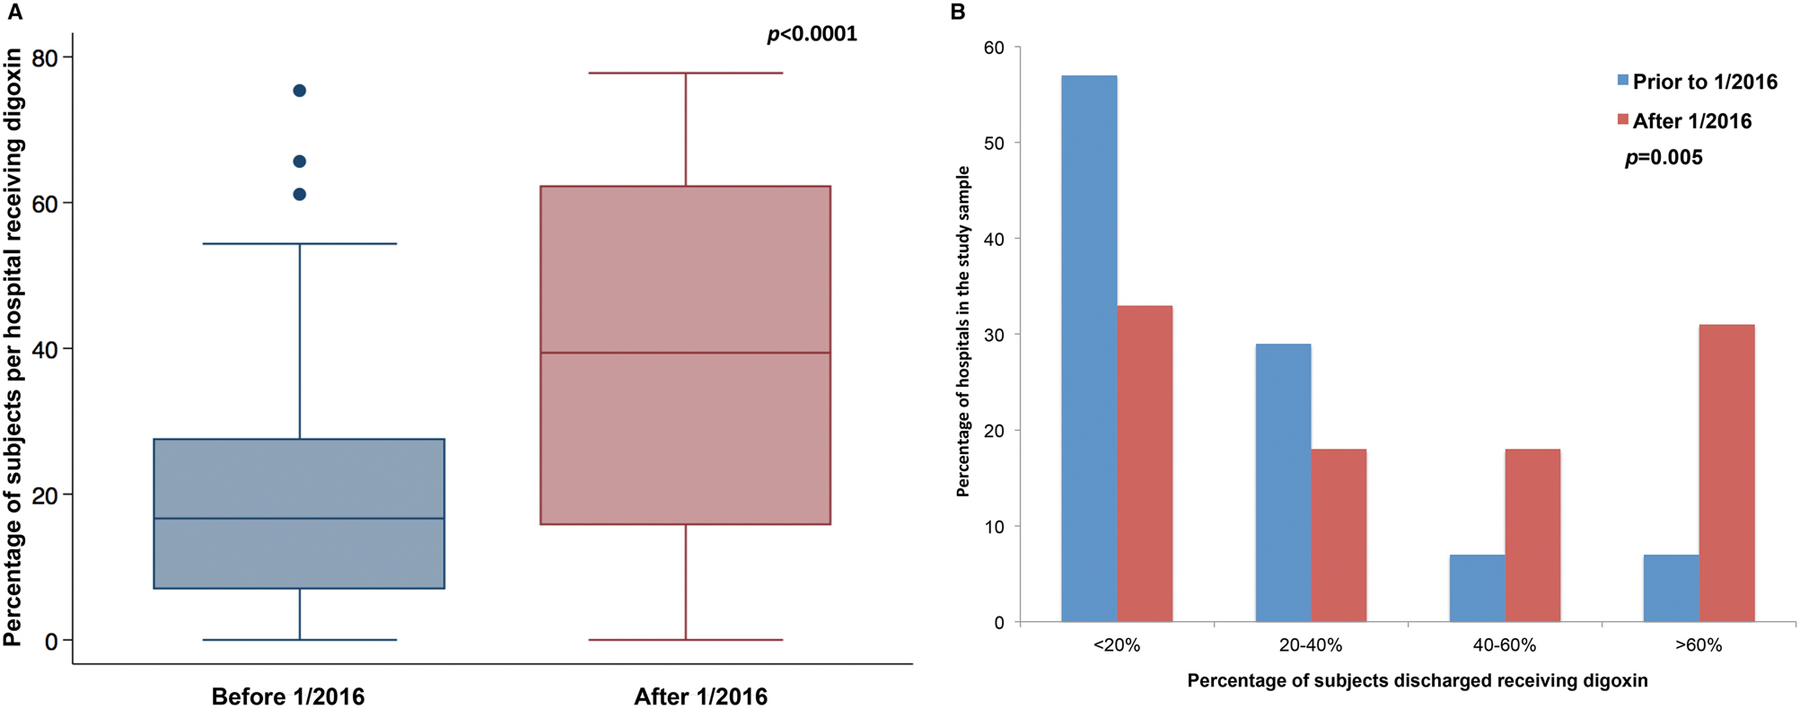
Figure 2: Use of digoxin by hospital.

A. Box and whiskers plot of the use of digoxin at hospitals in the study sample. The use of digoxin at the center level increased significantly (Sign rank test p<0.0001)
B. Bar graph depicts the hospitals-level distribution of discharge with digoxin after Norwood operation before (blue) and after (red) 1/1/2016. (Fisher’s exact test p=0.005)
