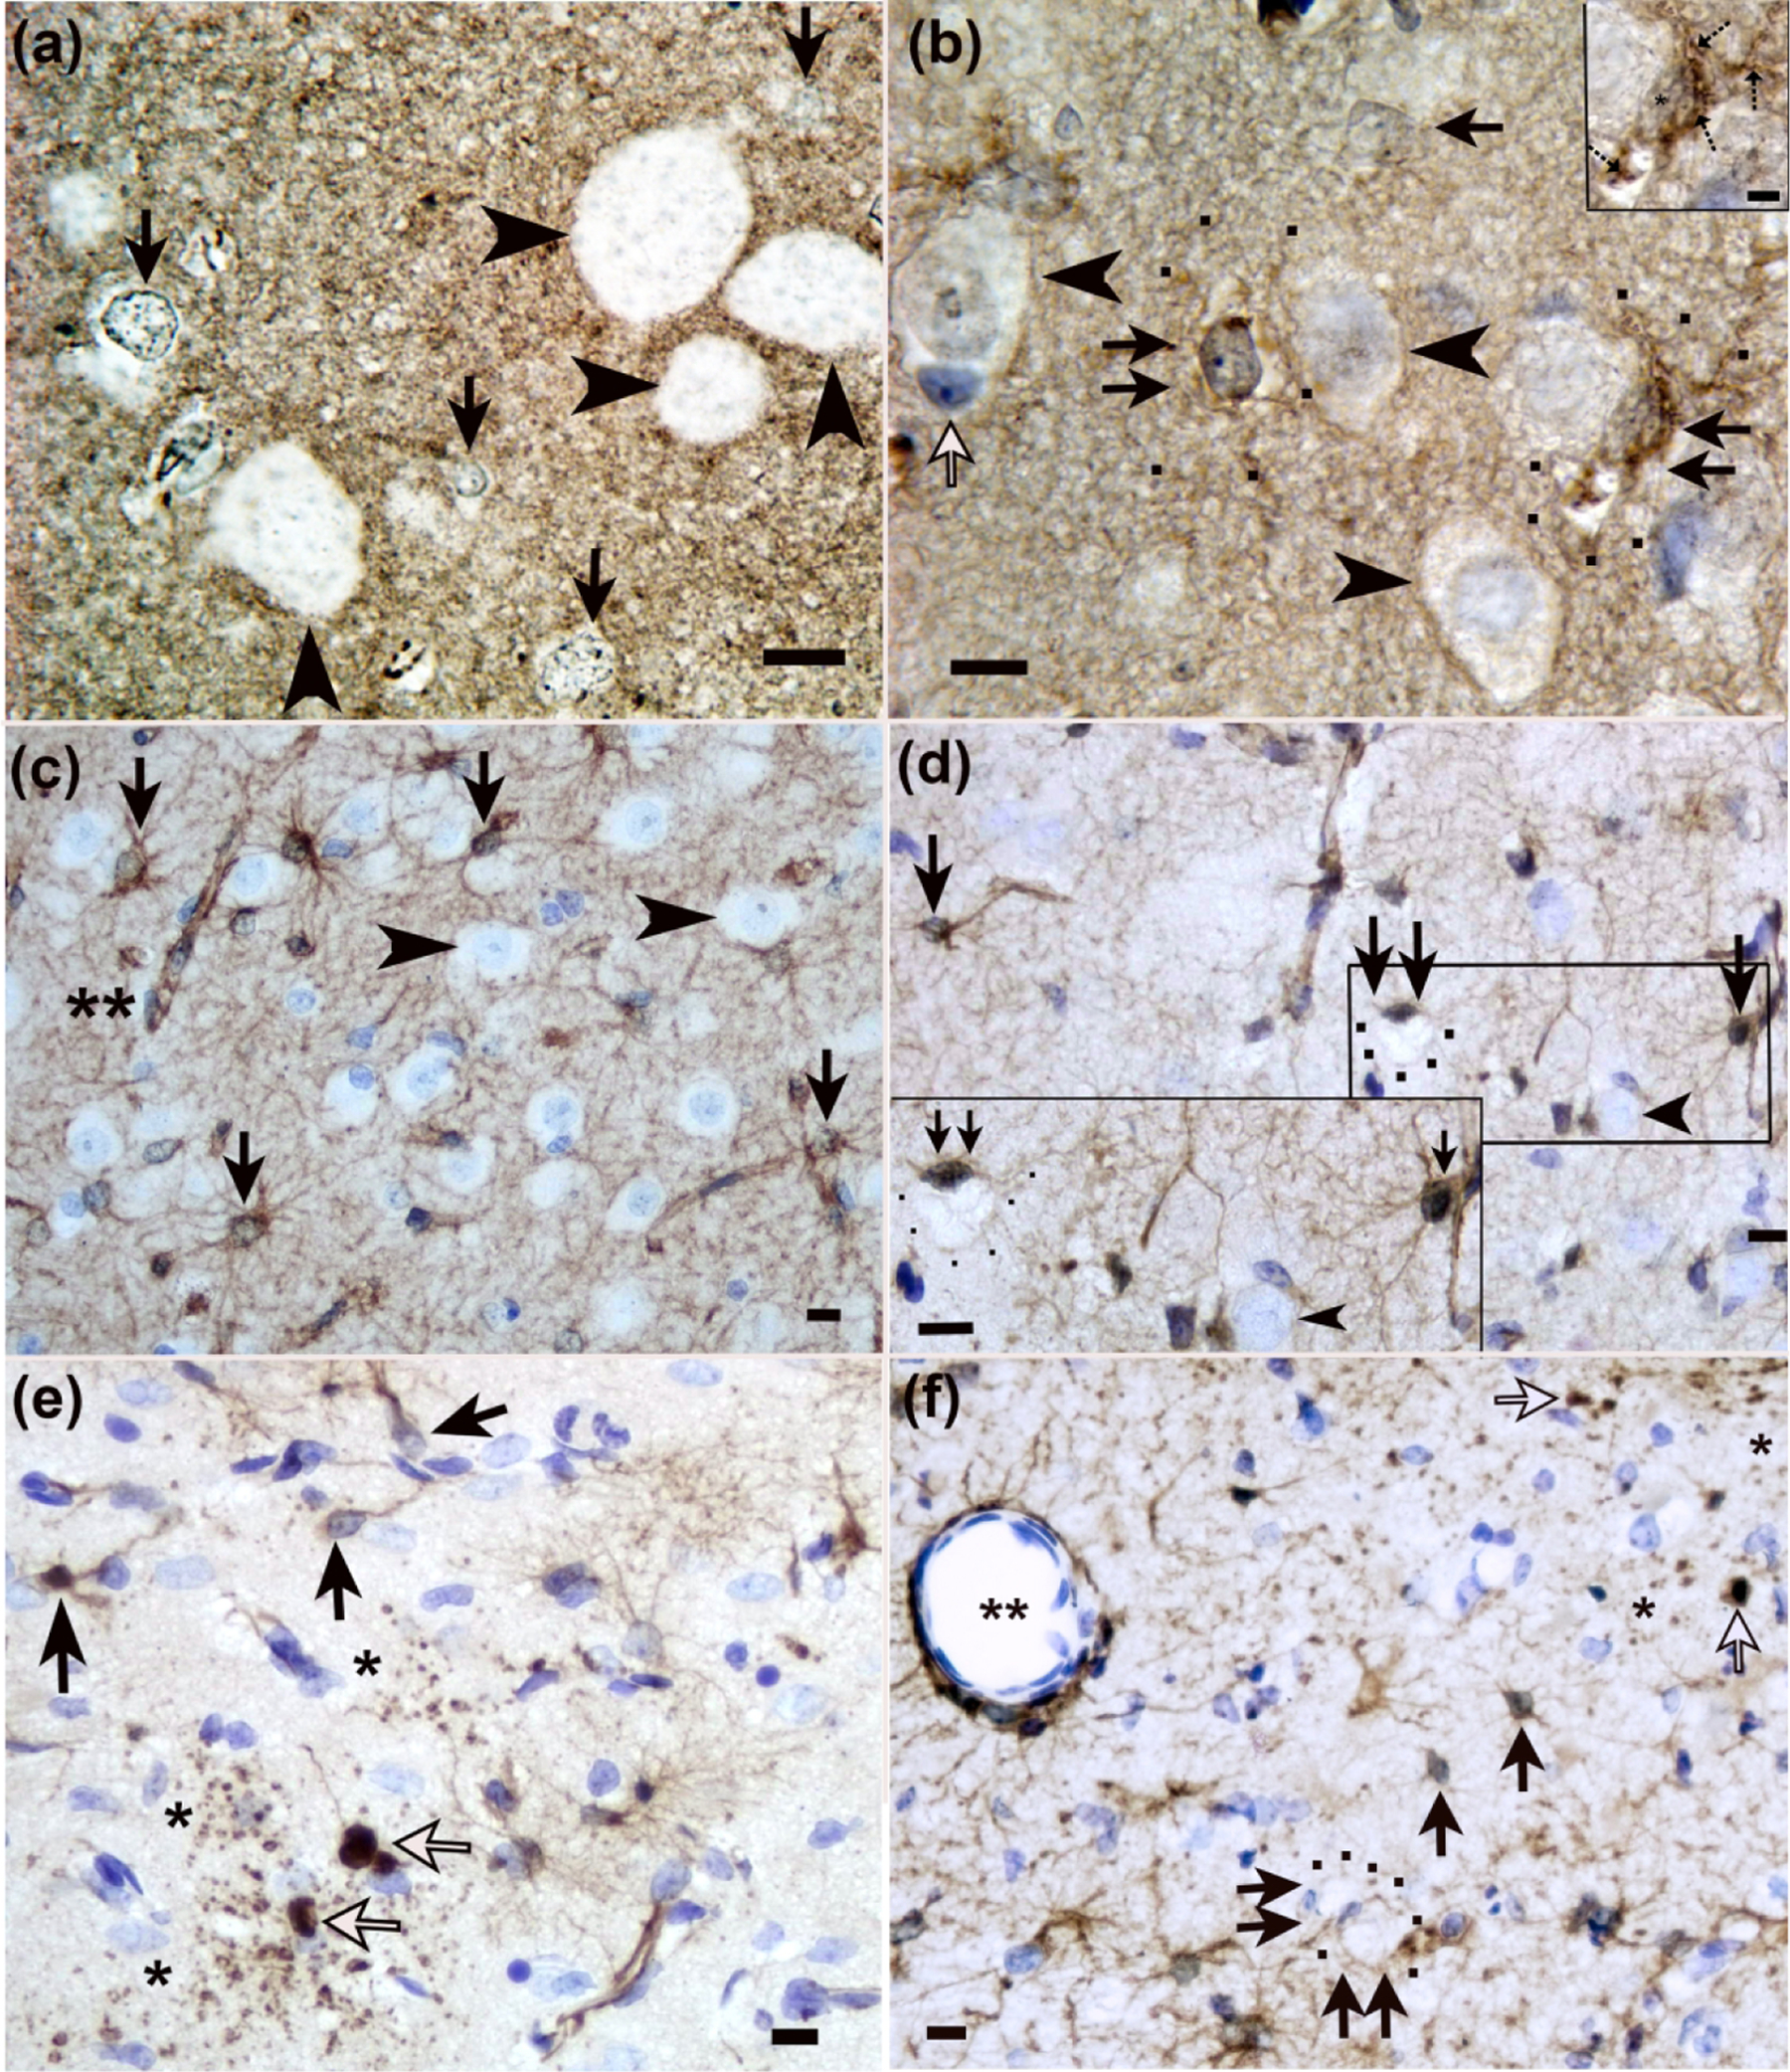
Figure 3.

Identification of astrocytes and astrocyte swelling in piglet encephalopathy using (a, b) aquaporin 4 (AQP4) and (c-f) glial fibrillary acidic protein (GFAP) immunohistochemistry. (a) A sham piglet had normal astrocytes with AQP4+ aggregates in the cell soma and nucleus but no prominent swelling (arrows) in putamen. The arrowheads show neurons. (b) Putamen of a piglet injected with 960 nmol quinolinic acid (QA) shows swollen astrocytes with AQP4+ aggregates, cytoplasmic swelling, and vacuoles (double arrows). The black dots outline AQP4-labeled distal processes of the enlarged astrocyte. The inset shows a swollen astrocyte with prominent AQP4+ aggregates in the cell body and processes (hatched arrows), vacuoles, and an asterisk marking the nucleus. In the main panel, the single arrows show astrocytes without swelling (white arrow: AQP4-negative; black single arrow: AQP4+). Arrowheads show neurons. (c) GFAP staining in sham putamen showed normal astrocytes (arrows). Perivascular astrocyte labeling showed no apparent vasogenic edema (double asterisks). Arrowheads denote neurons. (d) After hypoxia-ischemia (HI), the caudate had GFAP+ swollen astrocytes (double arrows), and black dots outline the swollen astrocyte’s soma. Single arrows show normal astrocytes. Neurons are marked by arrowheads. (e) Putamen of an HI piglet showed GFAP+ degenerating astrocytes (white arrows) with clasmatodendrosis (fragmentation of the astrocyte’s processes; asterisks). Black arrows show normal astrocytes and processes. (f) Injection of 960 nmol QA caused degeneration of GFAP+ astrocytes (white arrows) with clasmatodendrosis (single asterisks). Double arrows show two swollen astrocytes with enlarged cell bodies that are outlined by black dots. This astrocyte swelling is consistent with cytotoxic edema. The double asterisks show a vessel with tight AQP4 astrocyte labeling against the vessel wall without apparent vasogenic edema. Single black arrows show normal astrocytes. Panels A, B, and inset D were photographed at 1000x with oil immersion. The main panels C-F were photographed at 400x. Scale bars=10 μm in all main panels and inset D. The scale bar in inset B is 5 μm.
