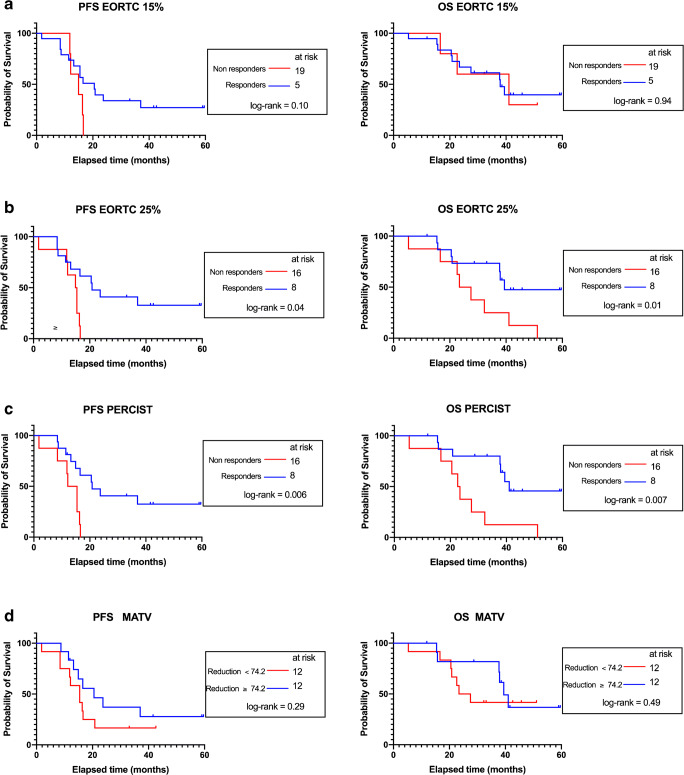
Fig. 3.
Kaplan-Meier survival curves for progression-free survival (PFS, left panels a–c) and overall survival (OS, right panels a–c) in responding (CMR, complete metabolic response or PMR, partial metabolic response) versus non-responding patients (SMD, stable metabolic disease or PMD, progressive metabolic disease) using SULmax (EORTC PET response criteria) and SULpeak (PERCIST). For metabolic active tumor volume (MATV) and total lesion glycolysis (TLG), the thresholds used to discriminate between responders and non-responders were the median values of the series (− 74.2% for MATV and − 78.3% for TLG). MATV and TLG being perfectly correlated, they produced similar results and only the Kaplan-Meier curves for MATV are displayed in panel d

