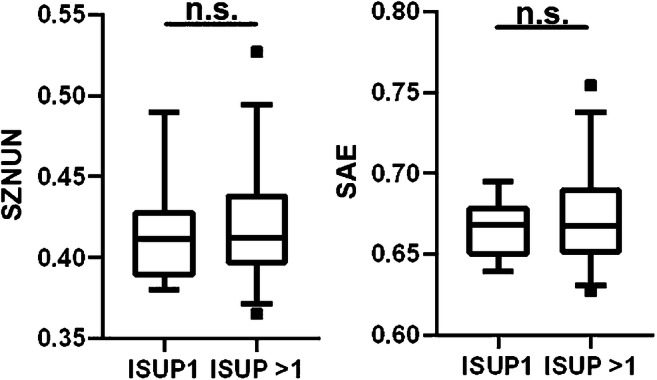
Fig. 4.

Performance of RF SAE and SZNUN for ISUP1 and ISUP > 1 discrimination. Two-tailed Mann-Whitney U test revealed no significant (p > 0.05) differences for both RFs between non-visible lesions with different ISUP scores. Boxplots are shown: the middle line in the box represents the median and the upper and lower ends of the box represent the 75th and 25th percentiles, respectively. The minimum and maximum values are also shown. SAE, local binary pattern small-area emphasis; SZNUN, local binary pattern size-zone non-uniformality normalized
